Test in a live environment
Test in production without watermarks.
Works wherever you need it to.
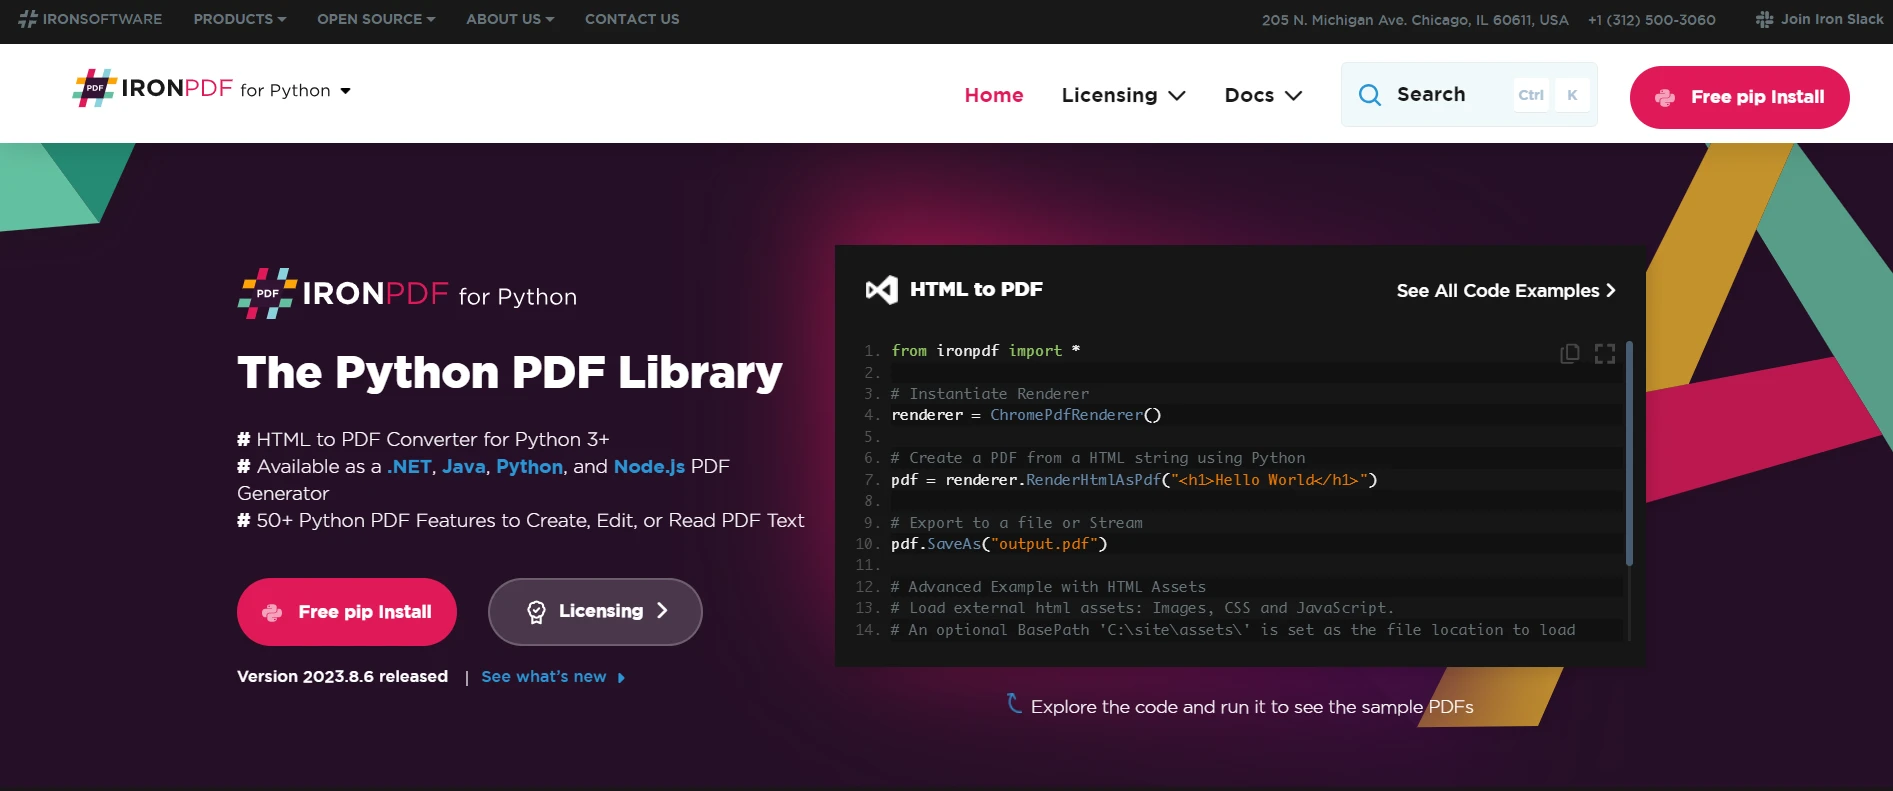
The Python PDF Library

Matplotlib is a widely used plotting library in the Python programming language. It is renowned for its versatility in generating a variety of plots, charts, and graphs. Originating as a tool for scientists and engineers, Matplotlib has grown into a cornerstone in the Python data visualization landscape. This article aims to provide an in-depth understanding of how Python's Matplotlib works, its key features, and how to effectively utilize it for data visualization.
Matplotlib is an open-source plotting library in Python. It provides an extensive range of plotting functions for creating static, interactive, and animated visualizations in Python. Matplotlib's functionality extends from simple line graphs to complex scatter plots, bar charts, and much more.
The pyplot function is a collection of command-style functions that make Matplotlib work like MATLAB. Each pyplot function makes changes to a figure, such as creating a figure, creating a plotting area, plotting some lines, decorating the plot with labels, etc. For those familiar with MATLAB, the pyplot function will seem quite natural to use.
A figure in Matplotlib refers to the whole window in the user interface. Within this figure, there can be one or more axes. An axes object represents what you think of as a 'plot', it is the region of the image with the data space. A given figure can contain many Axes, but a given Axes object can only be in one Figure. This distinction between axes and figures is important in understanding how Matplotlib organizes its plots.
To demonstrate how Matplotlib creates a plot, consider this example:
import matplotlib.pyplot as plt
plt.plot([1, 2, 3, 4])
plt.ylabel('some numbers')
plt.show()
In this code, plt.plot() creates the axes and figures implicitly. This is a code example of the pyplot function making the current axes and current figures.
While the pyplot function is useful for quick and easy plotting, Matplotlib also provides an object-oriented API. This is crucial when dealing with a canvas that has more than one axis. It gives you control over every single aspect of a plot. For instance, to create a subplot layout, you need to work with axes objects directly.
When dealing with complex visualizations, you often need multiple axes in a single figure. This is where understanding subplot layouts and how to manipulate axes objects becomes crucial.
Matplotlib allows for extensive customization, giving you control over almost every element of the plot, such as the y-axis, x-axis, labels, and much more. This level of detail might require more function calls and interaction with the axes API.
Matplotlib is capable of handling a variety of data types and structures. Whether it's simple lists or complex data structures from libraries like Pandas, Matplotlib can effortlessly plot them.
Matplotlib integrates seamlessly with Jupyter notebooks, providing an interactive environment to visualize data and tweak plots.
In the realm of Python data visualization and reporting, integrating PDF functionalities is often crucial. This is where IronPDF comes into play. IronPDF is a library developed by Iron Software, designed to create, edit, and read PDFs in Python applications. This library stands out due to its ability to seamlessly handle PDF files, making it an ideal choice for developers involved in PDF processing tasks.
When integrated with Matplotlib, IronPDF can enhance the functionality of Python's data visualization capabilities. For example, after generating a plot or chart with Matplotlib, you can use IronPDF to:
Export Plots as PDF: Directly save plots and charts as PDF files, which can be useful for reports, presentations, or archival purposes.
Customize PDF Output: Leverage IronPDF's features to customize the layout, format, and appearance of the PDFs containing Matplotlib visualizations.
Combine Multiple Visualizations: Compile multiple plots and charts into a single PDF document, ideal for creating comprehensive data reports.
In summary, IronPDF is a powerful tool that can significantly enhance the capabilities of Python's Matplotlib by providing robust PDF creation and editing functionalities. Its compatibility with various platforms and rich feature set make it an excellent addition to any Python project that requires advanced data visualization and reporting capabilities. Integrating IronPDF with Matplotlib opens up new possibilities for presenting and sharing data visualizations in professional and accessible formats.
IronPDF, allowing users to explore its extensive features without initial cost. Recognizing the needs of developers, it provides a free license for development, enabling cost-free integration in development environments.
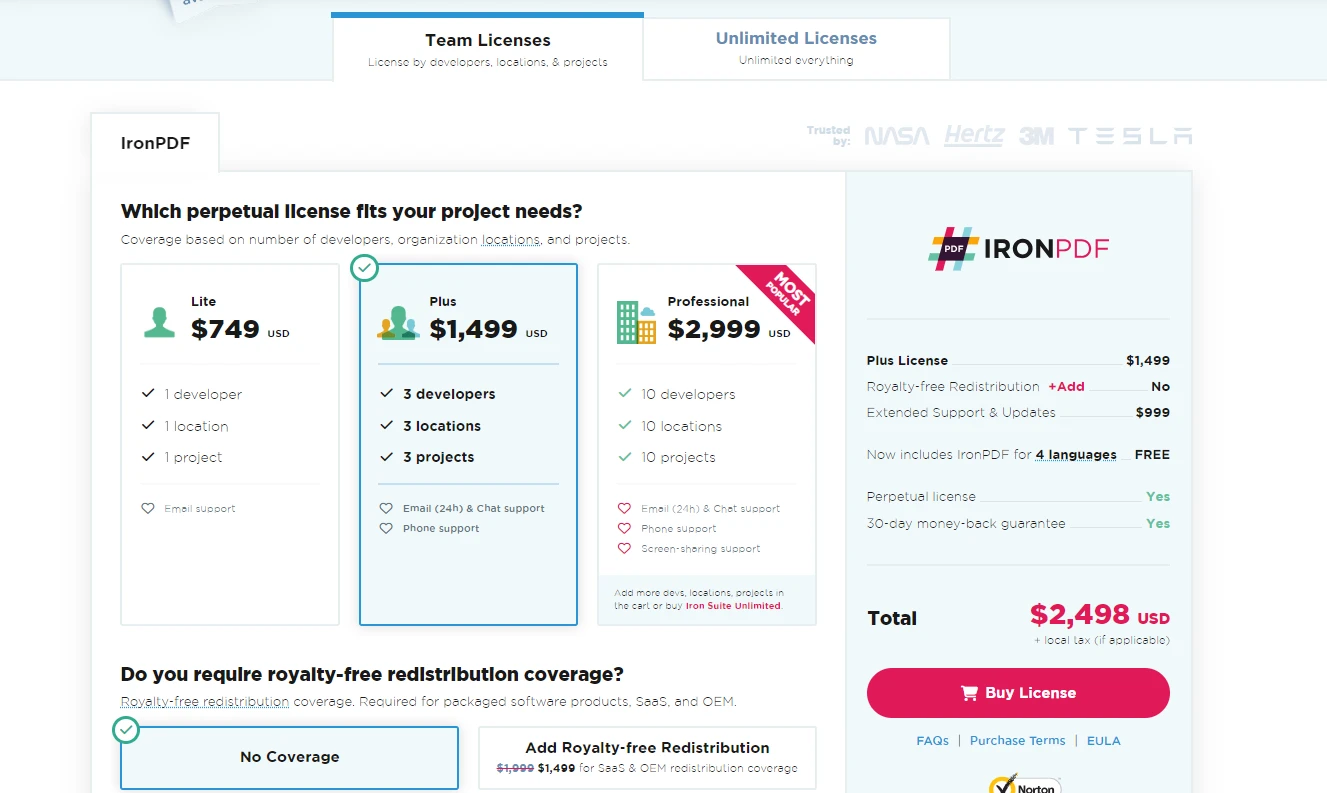
For more comprehensive needs, the full license starts at $749, offering a complete suite of PDF creation and editing tools for Python applications. IronPDF also provides a complete documentation. This documentation refers to various code examples and tutorials to guide users. For more information, please visit the documentation page.
30-day Trial Key instantly.
30-day Trial Key instantly.
Your trial key should be in the email.
If it is not, please contact
support@ironsoftware.com

pip install ironpdf-2024.5-py37-none-win_amd64.whiWant to deploy IronPDF to a live project for FREE?
Your trial key should be in the email.![]()
The trial form was submitted
successfully.
If it is not, please contact
support@ironsoftware.com
Want to deploy IronPDF to a live project for FREE?
Your trial key should be in the email.![]()
The trial form was submitted
successfully.
If it is not, please contact
support@ironsoftware.com
Want to deploy IronPDF to a live project for FREE?
Your trial key should be in the email.![]()
The trial form was submitted
successfully.
If it is not, please contact
support@ironsoftware.com
Want to deploy IronPDF to a live project for FREE?
Your trial key should be in the email.![]()
The trial form was submitted
successfully.
If it is not, please contact
support@ironsoftware.com

Get started for FREE
No credit card required
Test in production without watermarks.
Works wherever you need it to.
Get 30 days of fully functional product.
Have it up and running in minutes.
Full access to our support engineering team during your product trial
![]() No credit card or account creation required
No credit card or account creation required
Your trial key should be in the email.
If it is not, please contact
support@ironsoftware.com
Get started for FREE
No credit card required
Test in production without watermarks.
Works wherever you need it to.
Get 30 days of fully functional product.
Have it up and running in minutes.
Full access to our support engineering team during your product trial
Licenses from $749. Have a question? Get in touch.
9 .NET API products for your office documents
Thank you!
Your license key has been delivered to the email provided. Contact us

24-Hour Upgrade Offer:
Save 50% on a
Professional Upgrade
Go Professional to cover 10 developers
and unlimited projects.
hours
:
minutes
:
seconds

Professional
$600 USD
$299 USD
5 .NET Products for the Price of 2
Total Suite Value:
$7,192 USD