Igraph Python(開発者向けのしくみ)
グラフと複雑なネットワーク研究は、複雑な結合と相互作用をモデル化するために使用される計算機科学と数学の基本概念です。 グラフのノード(時には頂点とも呼ばれ)、およびエッジ(時にはリンクと呼ばれる)は、本質的に、ノードを結ぶエッジを通じて示されるエンティティとその関係の視覚的な表現と解釈に過ぎません。
より一般的に、交通システム、ソーシャルネットワーク、通信ネットワークに使用されるすべてのグラフは、ネットワークと見なされます。 グラフとネットワークを分析することで、接続性、流れ、ネットワーク構造に関連する問題を理解し、克服することができます。 こうした作業は、ソーシャルダイナミクスや組織構造から、効率的なルーティングと最適化のためのアルゴリズムに至るまで、多様な分野への洞察を提供します。 これらの概念は、ネットワーク理論、オペレーションズリサーチ、およびデータサイエンスにおいて非常に中心的なものです。
この記事では、igraphを使用してネットワークグラフを生成し、それらを柔軟で信頼性の高いIronPDFライブラリを使ってPDFファイルに印刷する方法を示します。
igraphとは何ですか?
Igraphは、複雑なグラフとネットワークを生成、操作、分析するための強力なPythonパッケージです。 グラフの生成から操作、その視覚化までを扱うための膨大なツールキットを提供します。 Pythonのigraphは、多くのアルゴリズムを通じて、中心性、最短経路、コミュニティ構造など、さまざまなメトリクスを計算するネットワーク分析の実装を容易にします。
このライブラリは、そのため、方向付きおよび無方向のグラフに適応したレイアウトとプロパティで良好な視覚化を提供し、非常に柔軟かつ高速で、データサイエンス、計算生物学、ソーシャルネットワーク研究などの難しい関係データの分析にしばしば使用されます。
igraph Pythonパッケージのセットアップと使用
まず、Pythonで基本的なグラフ理論の操作と設定を開始するために、自分自身でigraphを作成、設定、使用するための次の手順を利用します。
igraphパッケージのインストール
最初にigraphパッケージをインストールする必要があります。これには次のpipコマンドを使用できます:
pip install igraphpip install igraphIgraphを使用してグラフを作成する
igraphを使用してグラフを構築し設定する方法を示す簡単な例はこちらです:
from igraph import Graph, plot
# Create an empty graph
g = Graph()
# Add vertices (nodes)
g.add_vertices(5) # Adding 5 vertices
# Add edges (connections between vertices)
g.add_edges([(0, 1), (1, 2), (2, 3), (3, 4), (4, 0), (0, 2)]) # Adding edges
# Add vertex ids and edge attributes
g.vs["name"] = ["A", "B", "C", "D", "E"] # Vertex labels
g.es["weight"] = [1, 2, 3, 4, 5, 6] # Edge weights
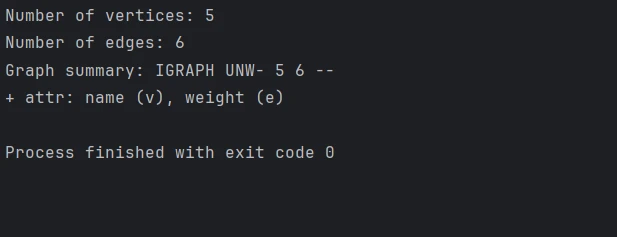
# Print basic graph structural properties
print("Number of vertices:", g.vcount())
print("Number of edges:", g.ecount())
print("Graph summary:", g.summary())from igraph import Graph, plot
# Create an empty graph
g = Graph()
# Add vertices (nodes)
g.add_vertices(5) # Adding 5 vertices
# Add edges (connections between vertices)
g.add_edges([(0, 1), (1, 2), (2, 3), (3, 4), (4, 0), (0, 2)]) # Adding edges
# Add vertex ids and edge attributes
g.vs["name"] = ["A", "B", "C", "D", "E"] # Vertex labels
g.es["weight"] = [1, 2, 3, 4, 5, 6] # Edge weights
# Print basic graph structural properties
print("Number of vertices:", g.vcount())
print("Number of edges:", g.ecount())
print("Graph summary:", g.summary())コンソール出力
グラフのレイアウトと視覚化を設定する
igraphの組み込み機能を使用してグラフを描画できます。 外観とレイアウトを以下のように変更します:
# Define a layout for the graph
layout = g.layout("circle")  # Layout in a circular arrangement

# Plot the graph with labels and custom options
plot(
    g,
    layout=layout,
    vertex_label=g.vs["name"],  # Label vertices
    vertex_color="lightblue",   # Vertex color
    edge_width=g.es["weight"],  # Edge width based on weight
    vertex_size=30,             # Vertex size
    edge_color="grey",          # Edge color
    bbox=(300, 300),            # Size of the plot
    margin=20                   # Margin around the plot
)

# Save the plotted graph to a file
plot(g, layout=layout, bbox=(300, 300), margin=20).save('exampleGraph.png')
# Define a layout for the graph
layout = g.layout("circle") # Layout in a circular arrangement
# Plot the graph with labels and custom options
plot(
g,
layout=layout,
vertex_label=g.vs["name"], # Label vertices
vertex_color="lightblue", # Vertex color
edge_width=g.es["weight"], # Edge width based on weight
vertex_size=30, # Vertex size
edge_color="grey", # Edge color
bbox=(300, 300), # Size of the plot
margin=20 # Margin around the plot
)
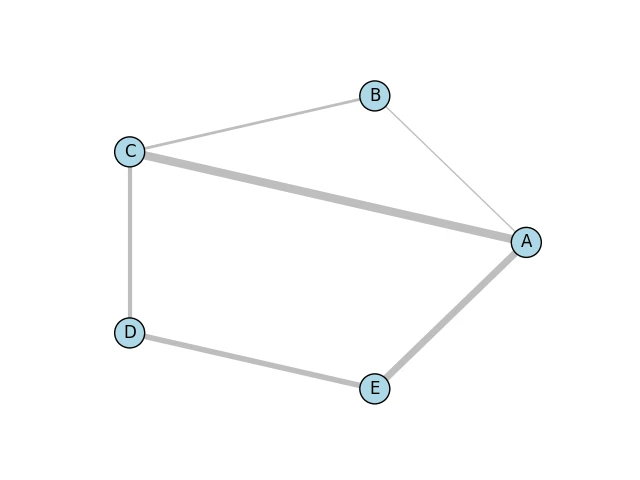
# Save the plotted graph to a file
plot(g, layout=layout, bbox=(300, 300), margin=20).save('exampleGraph.png') 出力されたグラフ
以下は、MatplotlibライブラリとCairoライブラリ for Pythonバインディングを利用して生成されたシンプルなグラフイメージです。
高度なグラフ操作
中心性の計算、コミュニティの発見、最短経路の特定など、さまざまなグラフ操作と分析を行います:
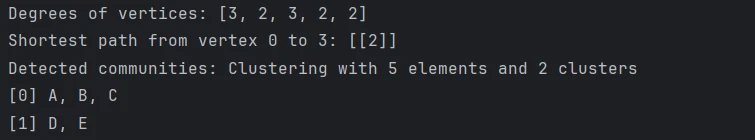
# Calculate degree centrality for each vertex
degrees = g.degree()
print("Degrees of vertices:", degrees)

# Compute shortest path between two vertices that don't have a predefined distance
shortest_path = g.shortest_paths_dijkstra(source=0, target=3)
print("Shortest path from vertex 0 to 3:", shortest_path)

# Detect communities using the Louvain method
communities = g.community_multilevel()
print("Detected communities:", communities)
# Calculate degree centrality for each vertex
degrees = g.degree()
print("Degrees of vertices:", degrees)
# Compute shortest path between two vertices that don't have a predefined distance
shortest_path = g.shortest_paths_dijkstra(source=0, target=3)
print("Shortest path from vertex 0 to 3:", shortest_path)
# Detect communities using the Louvain method
communities = g.community_multilevel()
print("Detected communities:", communities)コンソール出力
IronPDFの紹介
さらには、IronPDF Pythonモジュールを使用して、プログラムでPDFを生成および編集することができます。 このライブラリを使用すると、HTMLからPDFドキュメントを作成したり、2つ以上のPDFドキュメントを結合したり、既存のPDFを使用してそれらをテキスト、写真、注釈を含むように変更したりする大きな能力を持つことができます。 IronPDFは、レポート、請求書、その他のプリセットスタイルがあるドキュメントを生成するために適した、あらゆるHTMLサイトまたはウェブコンテンツからプロフェッショナル品質のPDFを生成することを可能にします。
その高度な機能のいくつかには、ページレイアウトの編集、ドキュメントの暗号化、PDFからのテキスト抽出が含まれます。 開発者は、PDFをより適切に扱うことで、製品の一般的な有用性を改善するためのより良い位置づけをすることができるでしょう。
IronPDFライブラリのインストール
プロジェクトのためにIronPDF機能を有効にするPythonインターフェースを可能にするパッケージをインストールするために、次のコマンドを使用することができます:
pip install ironpdf
igraphとIronPDFの統合
PythonでigraphとIronPDFを統合する際に実行する手順は次の通りです:まず、igraphでグラフを作成し、表示します。 その後、得られたビジュアライゼーションをPDFに変換します。
from igraph import Graph, plot
import matplotlib.pyplot as plt
from ironpdf import ImageToPdfConverter, License
import warnings

# Suppress warnings for cleaner output
warnings.filterwarnings('ignore')

# Ensure that you have replaced the string with your own license key
License.LicenseKey = "YOUR LICENSE KEY GOES HERE"

# Create an empty graph
g = Graph()

# Add adjacent vertices (nodes)
g.add_vertices(5)  # Adding 5 vertices

# Add edges (connections between vertices)
g.add_edges([(0, 1), (1, 2), (2, 3), (3, 4), (4, 0), (0, 2)])  # Adding edges

# Add vertex and edge attributes
g.vs["name"] = ["A", "B", "C", "D", "E"]  # Vertex labels
g.es["weight"] = [1, 2, 3, 4, 5, 6]  # Edge weights

# Define a layout for the graph
layout = g.layout("circle")  # Layout in a circular arrangement

# Create a plot using matplotlib
fig, ax = plt.subplots()

# Plot the graph with specified layout and styles
plot(
    g,
    target=ax,
    layout=layout,
    vertex_label=g.vs["name"],  # Label vertices
    vertex_color="lightblue",   # Vertex color
    edge_width=g.es["weight"],  # Edge width based on weight
    vertex_size=30,             # Vertex size
    edge_color="grey",          # Edge color
    bbox=(300, 300),            # Size of the plot
    margin=20                   # Margin around the plot
)

# Save the plot as a PNG image
plt.savefig('result.png')

# Convert the image to a PDF file
ImageToPdfConverter.ImageToPdf('result.png').SaveAs("result.pdf")
from igraph import Graph, plot
import matplotlib.pyplot as plt
from ironpdf import ImageToPdfConverter, License
import warnings
# Suppress warnings for cleaner output
warnings.filterwarnings('ignore')
# Ensure that you have replaced the string with your own license key
License.LicenseKey = "YOUR LICENSE KEY GOES HERE"
# Create an empty graph
g = Graph()
# Add adjacent vertices (nodes)
g.add_vertices(5) # Adding 5 vertices
# Add edges (connections between vertices)
g.add_edges([(0, 1), (1, 2), (2, 3), (3, 4), (4, 0), (0, 2)]) # Adding edges
# Add vertex and edge attributes
g.vs["name"] = ["A", "B", "C", "D", "E"] # Vertex labels
g.es["weight"] = [1, 2, 3, 4, 5, 6] # Edge weights
# Define a layout for the graph
layout = g.layout("circle") # Layout in a circular arrangement
# Create a plot using matplotlib
fig, ax = plt.subplots()
# Plot the graph with specified layout and styles
plot(
g,
target=ax,
layout=layout,
vertex_label=g.vs["name"], # Label vertices
vertex_color="lightblue", # Vertex color
edge_width=g.es["weight"], # Edge width based on weight
vertex_size=30, # Vertex size
edge_color="grey", # Edge color
bbox=(300, 300), # Size of the plot
margin=20 # Margin around the plot
)
# Save the plot as a PNG image
plt.savefig('result.png')
# Convert the image to a PDF file
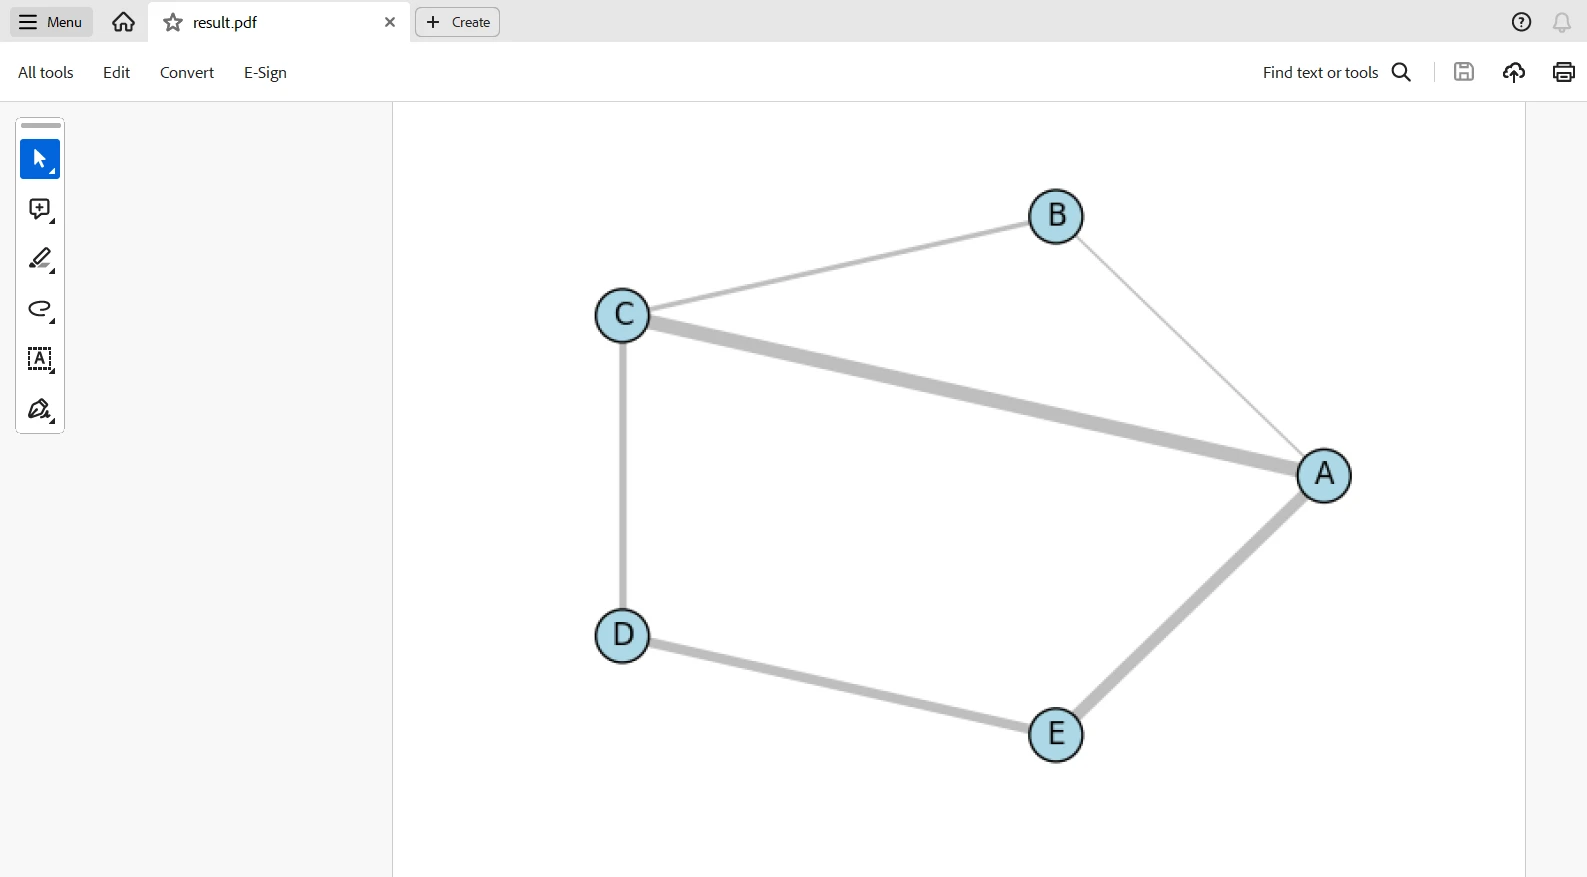
ImageToPdfConverter.ImageToPdf('result.png').SaveAs("result.pdf")このスクリプトは、igraphを通じてグラフを生成し、matplotlibで視覚化し、その後IronPDFを使用してチャートをPDFに変換します。 このコードは、すべての必要なライブラリをインポートし、ライセンスキーを使用してIronPDFをセットアップします。 5つの頂点と6つのエッジを持つ空のグラフを作成し、重みとラベルを追加して明確にします。
グラフは円形に配置され、プロットには、頂点の色とサイズ、エッジの線幅などのいくつかの視覚化プロパティを持つmatplotlibを含みます。 その後、結果は画像ファイルとして、result.png、保存されます。 最後に、IronPDFのImageToPdfConverterでPDF、result.pdfに変換されます。 グラフの作成、視覚化、およびPDF生成は1つのワークフローに組み込まれています。
出力されたPDF
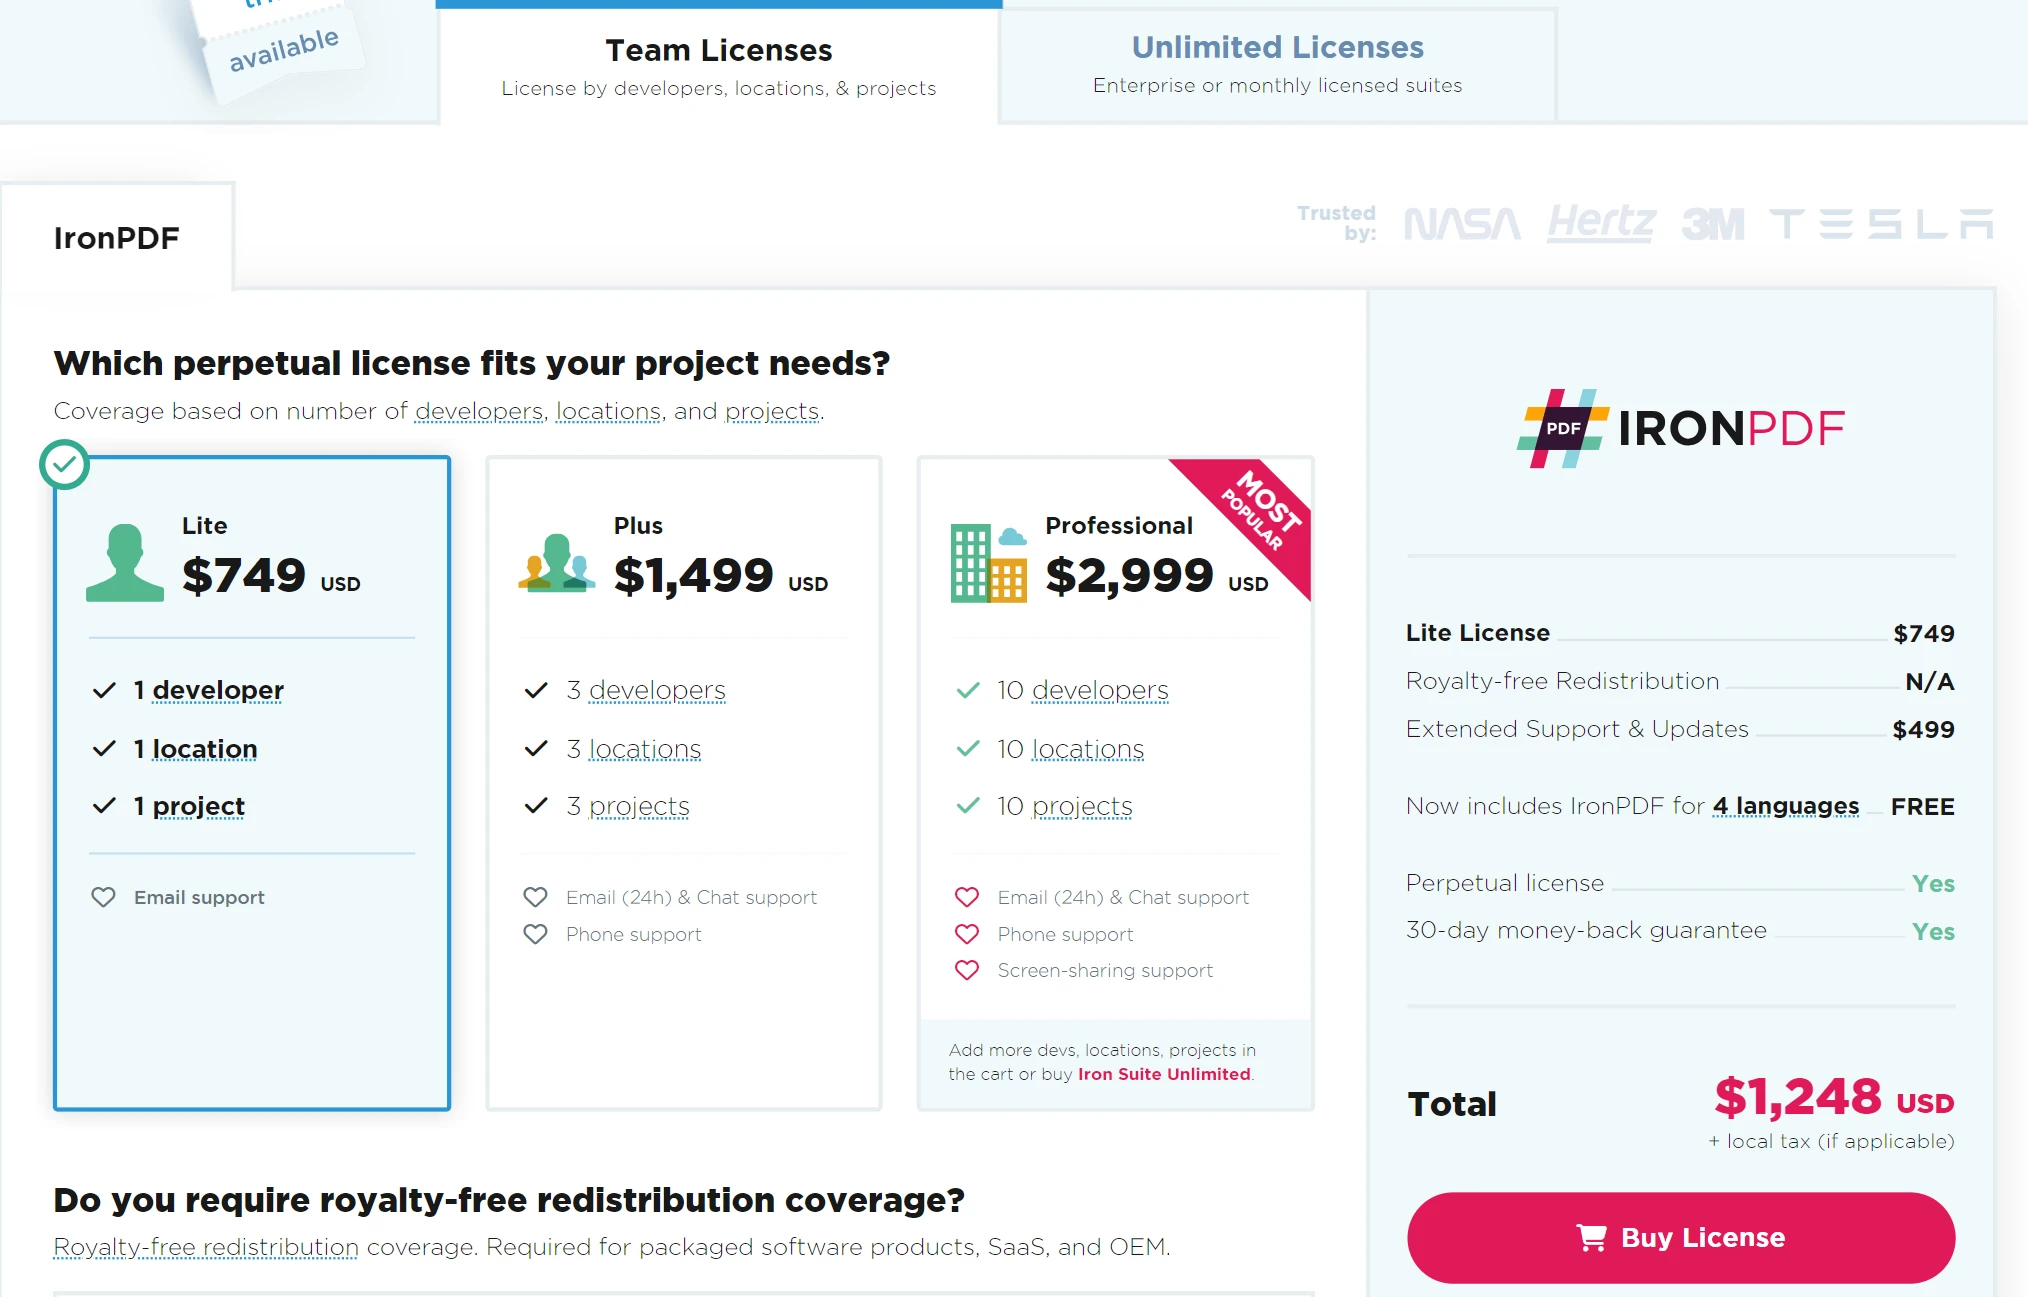
ライセンス
コードが透かしなしで動作するには、ライセンスキーが必要です。 このリンクで無料の試用ライセンスに登録できます。 本人確認書類を提供せずに登録することができることに注意してください。 無料トライアル版に登録するためには自分のメールアドレスを入力するだけです。
結論
IronPDFとigraphの力を利用して、複雑なグラフデータを視覚化および表示するためのソリューションを開発できます。 igraphを通じて、複雑なネットワークを簡単に作成および分析でき、IronPDFを使用してデータビジュアライゼーションをプロフェッショナルレベルのPDF文書にシームレスに変換できます。 これらの結合された力は、グラフ分析と視覚的表現の両方を含む包括的なレポートを開発するのに役立ちます。
この統合により、学術研究、ビジネス分析、データ駆動型レポートなど、包括的なネットワークドキュメンテーションを要求するさまざまなアプリケーションを開発することができます。 さらに、それは高品質なドキュメント出力と非常に強力な操作能力をグラフと組み合わせます。その上に、Iron Softwareは、Windows、Android、MAC、Linuxなどのさまざまなプラットフォームおよびオペレーティングシステム用のアプリケーションを開発しやすくする多様なライブラリを提供しています。