igraph Python (개발자를 위한 작동 방식)
그래프와 복잡 네트워크 연구는 복잡한 연결과 상호 작용을 모델링하는 데 사용되는 컴퓨터 과학 및 수학의 기본 개념입니다. 그래프의 노드(정점이라고도 함)와 에지(링크라고도 함)는 본질적으로 개체와 그 개체 간의 관계를 시각적으로 표현하고 해석한 것으로, 노드를 연결하는 에지를 통해 나타납니다.
더 일반적으로 말하면, 교통 시스템, 소셜 네트워크, 통신 네트워크에 사용되는 모든 그래프는 네트워크로 간주됩니다. 그래프와 네트워크를 살펴보면 연결성, 흐름, 네트워크 구조와 관련된 문제를 이해하고 해결할 수 있습니다. 이러한 연구는 사회 역학 및 조직 구조에서부터 효율적인 경로 설정 및 최적화 알고리즘에 이르기까지 다양한 분야에 대한 통찰력을 제공합니다. 이러한 개념들은 네트워크 이론, 운영 연구 및 데이터 과학에서 매우 중요한 역할을 합니다.
이 문서에서는 igraph를 사용하여 유연하고 안정적인 IronPDF 라이브러리를 활용해 네트워크 그래프를 생성하고 PDF 파일로 출력하는 방법을 보여줍니다.
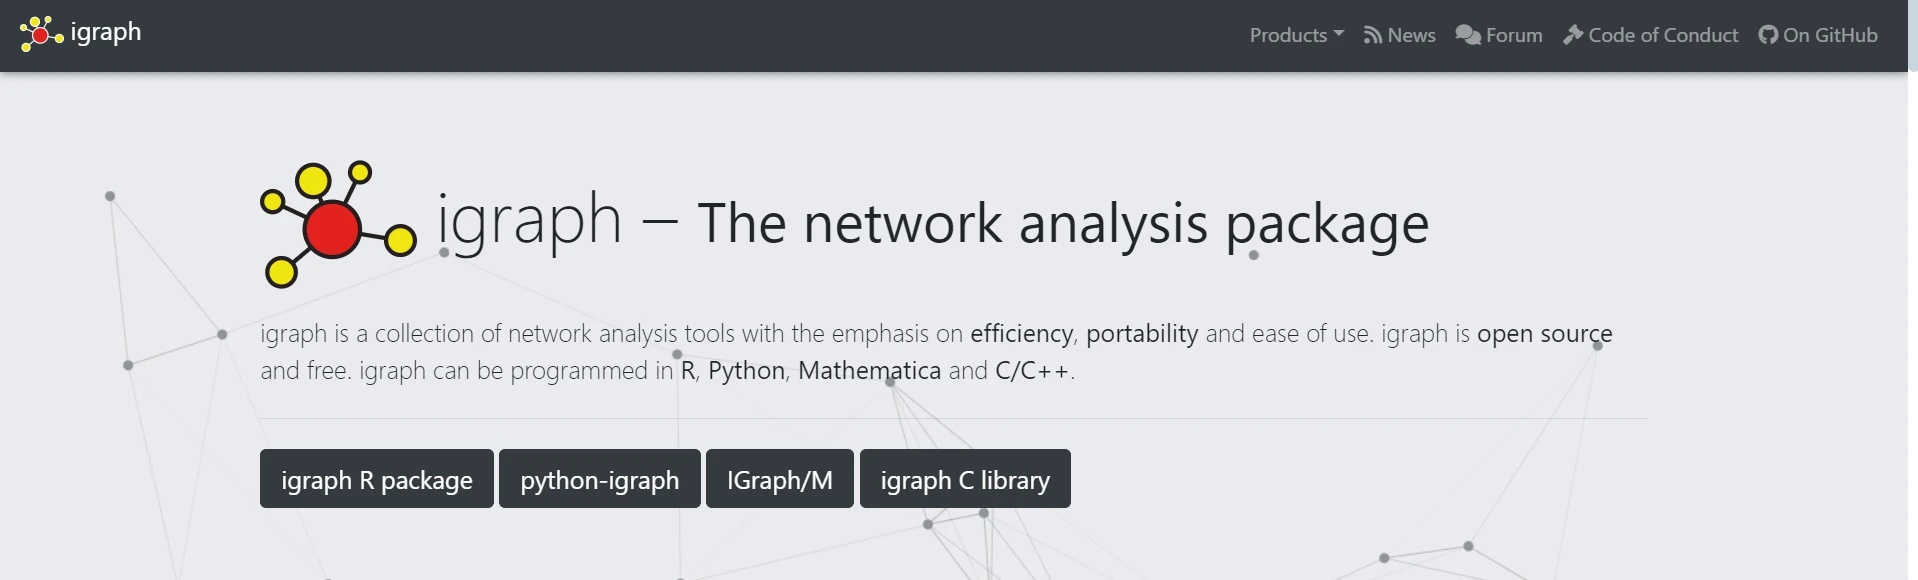
igraph란 무엇인가요?
igraph 는 복잡한 그래프와 네트워크를 생성, 조작 및 분석하는 데 유용한 강력한 Python 패키지입니다. 이 소프트웨어는 그래프 생성부터 조작 및 시각화에 이르기까지 그래프를 다루는 데 필요한 방대한 도구를 제공합니다. Python igraph는 중심성, 최단 경로, 커뮤니티 구조 등 다양한 지표를 계산하는 여러 알고리즘을 통해 네트워크 분석 구현을 용이하게 합니다.
이 라이브러리는 방향 그래프와 무방향 그래프 모두에 대해 적응형 레이아웃과 속성을 활용한 뛰어난 시각화 기능을 제공합니다. igraph는 매우 유연하고 빠르며, 데이터 과학, 계산 생물학, 소셜 네트워크 연구와 같이 복잡한 관계형 데이터를 분석하는 분야에서 널리 사용됩니다.
igraph Python 패키지 설정 및 사용
Python에서 그래프 이론의 기본 연산 및 설정을 시작하려면 다음 단계를 따라 igraph를 직접 생성, 구성 및 사용해 보세요.
igraph Install-Package
먼저 igraph 패키지를 설치해야 합니다. 다음 pip 명령어를 사용하여 설치할 수 있습니다.
pip install igraphpip install igraphiGraph를 사용하여 그래프 생성
다음은 igraph를 사용하여 그래프를 구성하고 설정하는 방법을 보여주는 간단한 예입니다.
from igraph import Graph, plot
# Create an empty graph
g = Graph()
# Add vertices (nodes)
g.add_vertices(5) # Adding 5 vertices
# Add edges (connections between vertices)
g.add_edges([(0, 1), (1, 2), (2, 3), (3, 4), (4, 0), (0, 2)]) # Adding edges
# Add vertex ids and edge attributes
g.vs["name"] = ["A", "B", "C", "D", "E"] # Vertex labels
g.es["weight"] = [1, 2, 3, 4, 5, 6] # Edge weights
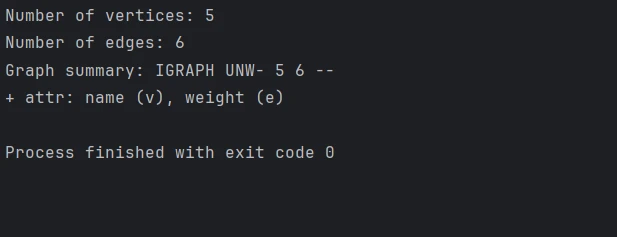
# Print basic graph structural properties
print("Number of vertices:", g.vcount())
print("Number of edges:", g.ecount())
print("Graph summary:", g.summary())from igraph import Graph, plot
# Create an empty graph
g = Graph()
# Add vertices (nodes)
g.add_vertices(5) # Adding 5 vertices
# Add edges (connections between vertices)
g.add_edges([(0, 1), (1, 2), (2, 3), (3, 4), (4, 0), (0, 2)]) # Adding edges
# Add vertex ids and edge attributes
g.vs["name"] = ["A", "B", "C", "D", "E"] # Vertex labels
g.es["weight"] = [1, 2, 3, 4, 5, 6] # Edge weights
# Print basic graph structural properties
print("Number of vertices:", g.vcount())
print("Number of edges:", g.ecount())
print("Graph summary:", g.summary())콘솔 출력
그래프 레이아웃 및 시각화 구성
igraph의 내장 기능을 사용하여 그래프를 그릴 수 있습니다. 다음 명령어를 사용하여 모양과 레이아웃을 변경하세요.
# Define a layout for the graph
layout = g.layout("circle")  # Layout in a circular arrangement

# Plot the graph with labels and custom options
plot(
    g,
    layout=layout,
    vertex_label=g.vs["name"],  # Label vertices
    vertex_color="lightblue",   # Vertex color
    edge_width=g.es["weight"],  # Edge width based on weight
    vertex_size=30,             # Vertex size
    edge_color="grey",          # Edge color
    bbox=(300, 300),            # Size of the plot
    margin=20                   # Margin around the plot
)

# Save the plotted graph to a file
plot(g, layout=layout, bbox=(300, 300), margin=20).save('exampleGraph.png')
# Define a layout for the graph
layout = g.layout("circle") # Layout in a circular arrangement
# Plot the graph with labels and custom options
plot(
g,
layout=layout,
vertex_label=g.vs["name"], # Label vertices
vertex_color="lightblue", # Vertex color
edge_width=g.es["weight"], # Edge width based on weight
vertex_size=30, # Vertex size
edge_color="grey", # Edge color
bbox=(300, 300), # Size of the plot
margin=20 # Margin around the plot
)
# Save the plotted graph to a file
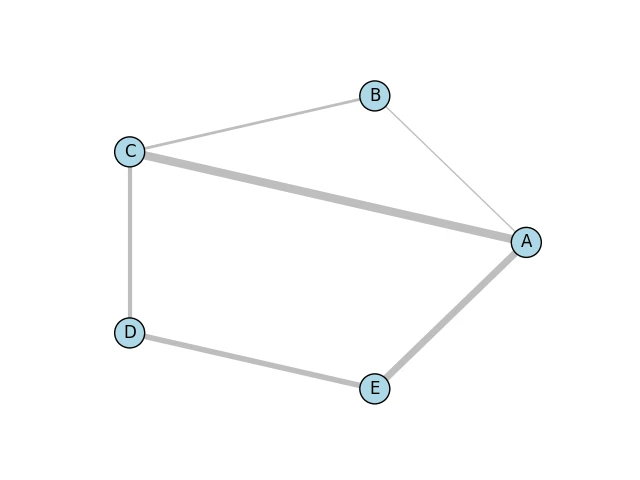
plot(g, layout=layout, bbox=(300, 300), margin=20).save('exampleGraph.png') 출력된 그래프
아래는 Matplotlib 라이브러리와 Cairo 라이브러리의 Python 바인딩을 이용하여 생성된 간단한 그래프 이미지입니다.
고급 그래프 연산
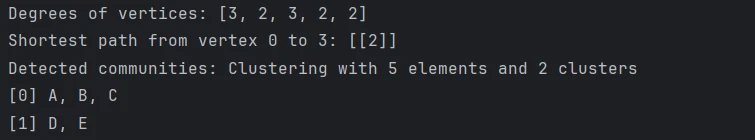
중심성 계산, 커뮤니티 찾기, 최단 경로 식별 등 다양한 그래프 연산 및 분석을 수행합니다.
# Calculate degree centrality for each vertex
degrees = g.degree()
print("Degrees of vertices:", degrees)

# Compute shortest path between two vertices that don't have a predefined distance
shortest_path = g.shortest_paths_dijkstra(source=0, target=3)
print("Shortest path from vertex 0 to 3:", shortest_path)

# Detect communities using the Louvain method
communities = g.community_multilevel()
print("Detected communities:", communities)
# Calculate degree centrality for each vertex
degrees = g.degree()
print("Degrees of vertices:", degrees)
# Compute shortest path between two vertices that don't have a predefined distance
shortest_path = g.shortest_paths_dijkstra(source=0, target=3)
print("Shortest path from vertex 0 to 3:", shortest_path)
# Detect communities using the Louvain method
communities = g.community_multilevel()
print("Detected communities:", communities)콘솔 출력
IronPDF 소개합니다
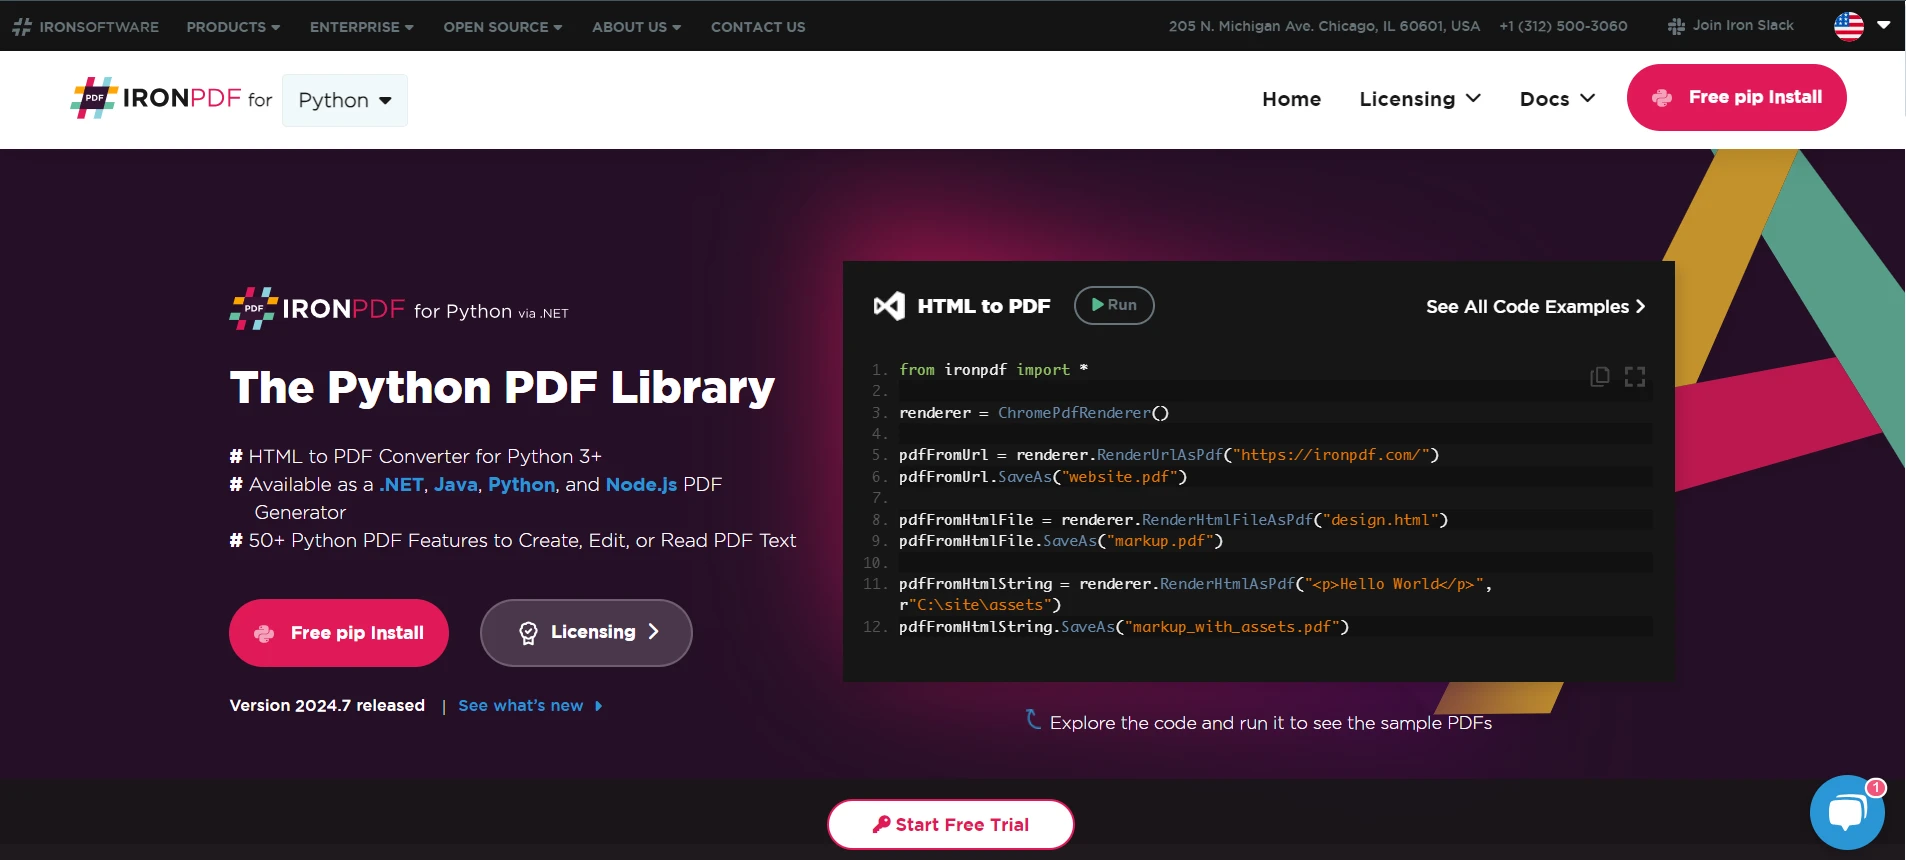
IronPDF Python 모듈을 사용하면 PDF를 프로그래밍 방식으로 생성하고 편집할 수도 있습니다. 이 라이브러리를 사용하면 HTML에서 PDF 문서를 생성하고, 두 개 이상의 PDF 문서를 병합하고, 기존 PDF를 활용하여 텍스트, 사진 및 주석을 포함하도록 수정할 수 있는 엄청난 기능을 활용할 수 있습니다. IronPDF 사용하면 모든 HTML 사이트 또는 웹 콘텐츠에서 보고서, 송장 및 기타 사전 설정된 스타일이 적용된 문서를 생성하는 데 적합한 전문가 수준의 PDF를 생성할 수 있습니다.
이 프로그램의 고급 기능에는 페이지 레이아웃 편집, 문서 암호화 및 PDF에서 텍스트 추출 등이 포함됩니다. 개발자들이 PDF를 더 잘 다룰 수 있게 되면 제품의 전반적인 유용성을 향상시키는 데 도움이 될 것입니다.
IronPDF 라이브러리 설치
다음 명령어를 사용하여 Python 인터페이스가 프로젝트에서 IronPDF 기능을 활성화할 수 있도록 하는 패키지를 설치할 수 있습니다.
pip install ironpdf
igraph와 IronPDF 통합
다음은 igraph와 IronPDF 병합하기 위해 Python에서 수행하는 단계입니다. 먼저 igraph를 사용하여 그래프를 생성하고 표시합니다. 그런 다음, 생성된 시각화 자료를 PDF 파일로 변환합니다.
from igraph import Graph, plot
import matplotlib.pyplot as plt
from ironpdf import ImageToPdfConverter, License
import warnings

# Suppress warnings for cleaner output
warnings.filterwarnings('ignore')

# Ensure that you have replaced the string with your own license key
License.LicenseKey = "YOUR LICENSE KEY GOES HERE"

# Create an empty graph
g = Graph()

# Add adjacent vertices (nodes)
g.add_vertices(5)  # Adding 5 vertices

# Add edges (connections between vertices)
g.add_edges([(0, 1), (1, 2), (2, 3), (3, 4), (4, 0), (0, 2)])  # Adding edges

# Add vertex and edge attributes
g.vs["name"] = ["A", "B", "C", "D", "E"]  # Vertex labels
g.es["weight"] = [1, 2, 3, 4, 5, 6]  # Edge weights

# Define a layout for the graph
layout = g.layout("circle")  # Layout in a circular arrangement

# Create a plot using matplotlib
fig, ax = plt.subplots()

# Plot the graph with specified layout and styles
plot(
    g,
    target=ax,
    layout=layout,
    vertex_label=g.vs["name"],  # Label vertices
    vertex_color="lightblue",   # Vertex color
    edge_width=g.es["weight"],  # Edge width based on weight
    vertex_size=30,             # Vertex size
    edge_color="grey",          # Edge color
    bbox=(300, 300),            # Size of the plot
    margin=20                   # Margin around the plot
)

# Save the plot as a PNG image
plt.savefig('result.png')

# Convert the image to a PDF file
ImageToPdfConverter.ImageToPdf('result.png').SaveAs("result.pdf")
from igraph import Graph, plot
import matplotlib.pyplot as plt
from ironpdf import ImageToPdfConverter, License
import warnings
# Suppress warnings for cleaner output
warnings.filterwarnings('ignore')
# Ensure that you have replaced the string with your own license key
License.LicenseKey = "YOUR LICENSE KEY GOES HERE"
# Create an empty graph
g = Graph()
# Add adjacent vertices (nodes)
g.add_vertices(5) # Adding 5 vertices
# Add edges (connections between vertices)
g.add_edges([(0, 1), (1, 2), (2, 3), (3, 4), (4, 0), (0, 2)]) # Adding edges
# Add vertex and edge attributes
g.vs["name"] = ["A", "B", "C", "D", "E"] # Vertex labels
g.es["weight"] = [1, 2, 3, 4, 5, 6] # Edge weights
# Define a layout for the graph
layout = g.layout("circle") # Layout in a circular arrangement
# Create a plot using matplotlib
fig, ax = plt.subplots()
# Plot the graph with specified layout and styles
plot(
g,
target=ax,
layout=layout,
vertex_label=g.vs["name"], # Label vertices
vertex_color="lightblue", # Vertex color
edge_width=g.es["weight"], # Edge width based on weight
vertex_size=30, # Vertex size
edge_color="grey", # Edge color
bbox=(300, 300), # Size of the plot
margin=20 # Margin around the plot
)
# Save the plot as a PNG image
plt.savefig('result.png')
# Convert the image to a PDF file
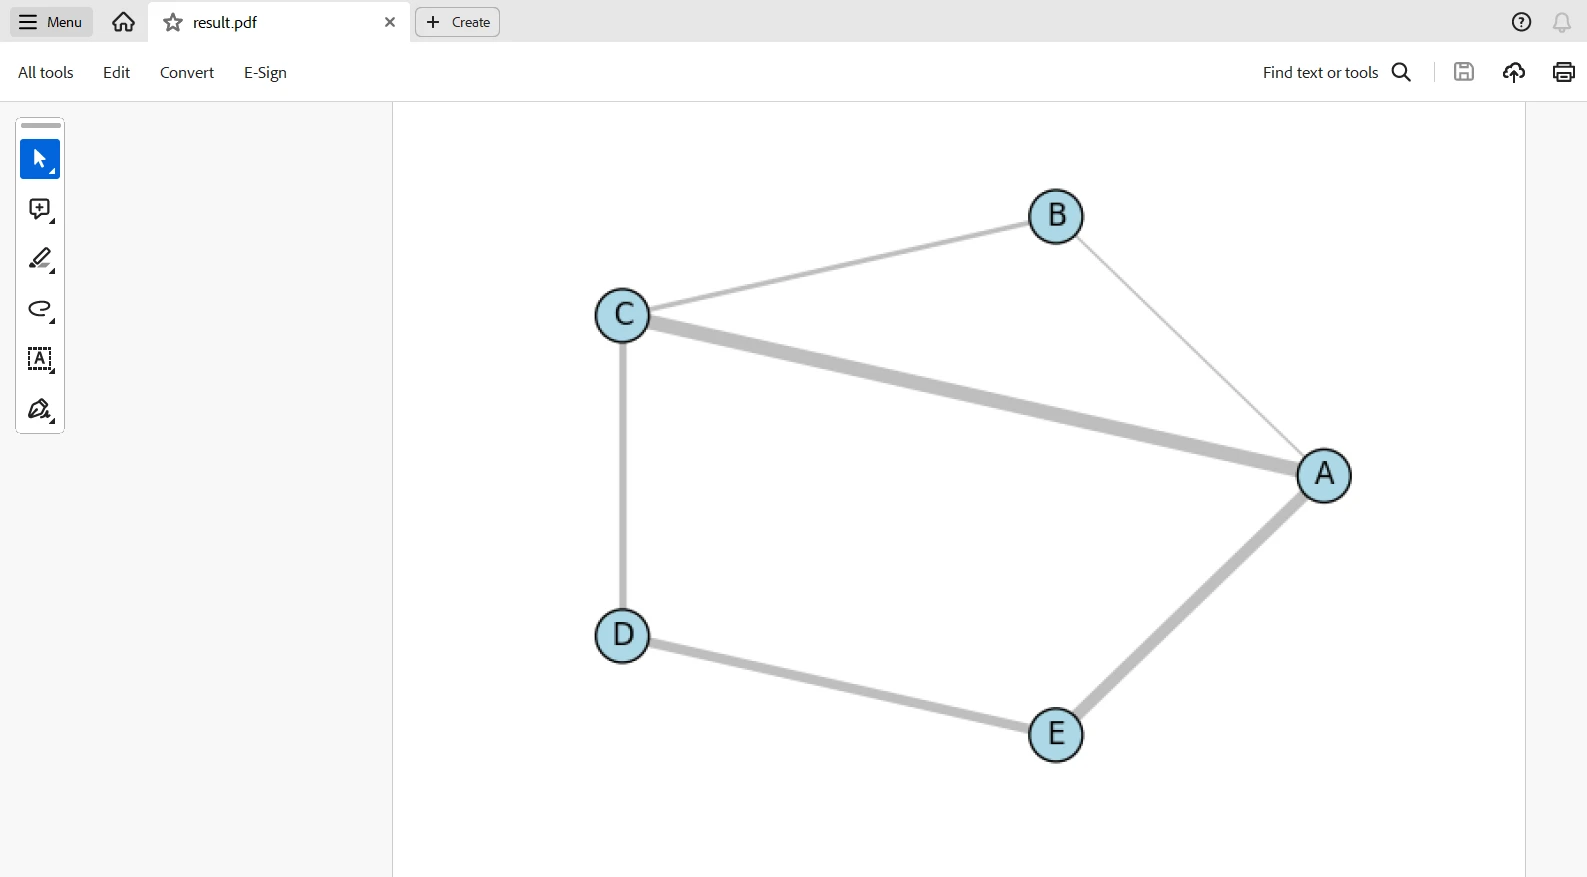
ImageToPdfConverter.ImageToPdf('result.png').SaveAs("result.pdf")이 스크립트는 igraph를 통해 그래프를 생성하고, matplotlib으로 시각화한 다음, IronPDF 사용하여 차트를 PDF로 변환합니다. 이 코드는 필요한 모든 라이브러리를 가져오고 라이선스 키를 사용하여 IronPDF 설정합니다. 정점 5개와 간선 6개를 가진 빈 그래프를 생성하고, 가독성을 높이기 위해 가중치와 레이블을 추가하세요.
그래프는 원형으로 배치되며, 플롯에는 matplotlib이 사용되고 정점 색상 및 크기, 변 선 두께와 같은 여러 시각화 속성이 적용됩니다. 그 후, 그 결과는 이미지 파일 result.png로 저장됩니다. 마지막으로, IronPDF의 ImageToPdfConverter를 사용하여 result.pdf로 PDF로 변환됩니다. 그래프 생성, 시각화 및 PDF 생성이 하나의 워크플로로 통합됩니다.
출력된 PDF
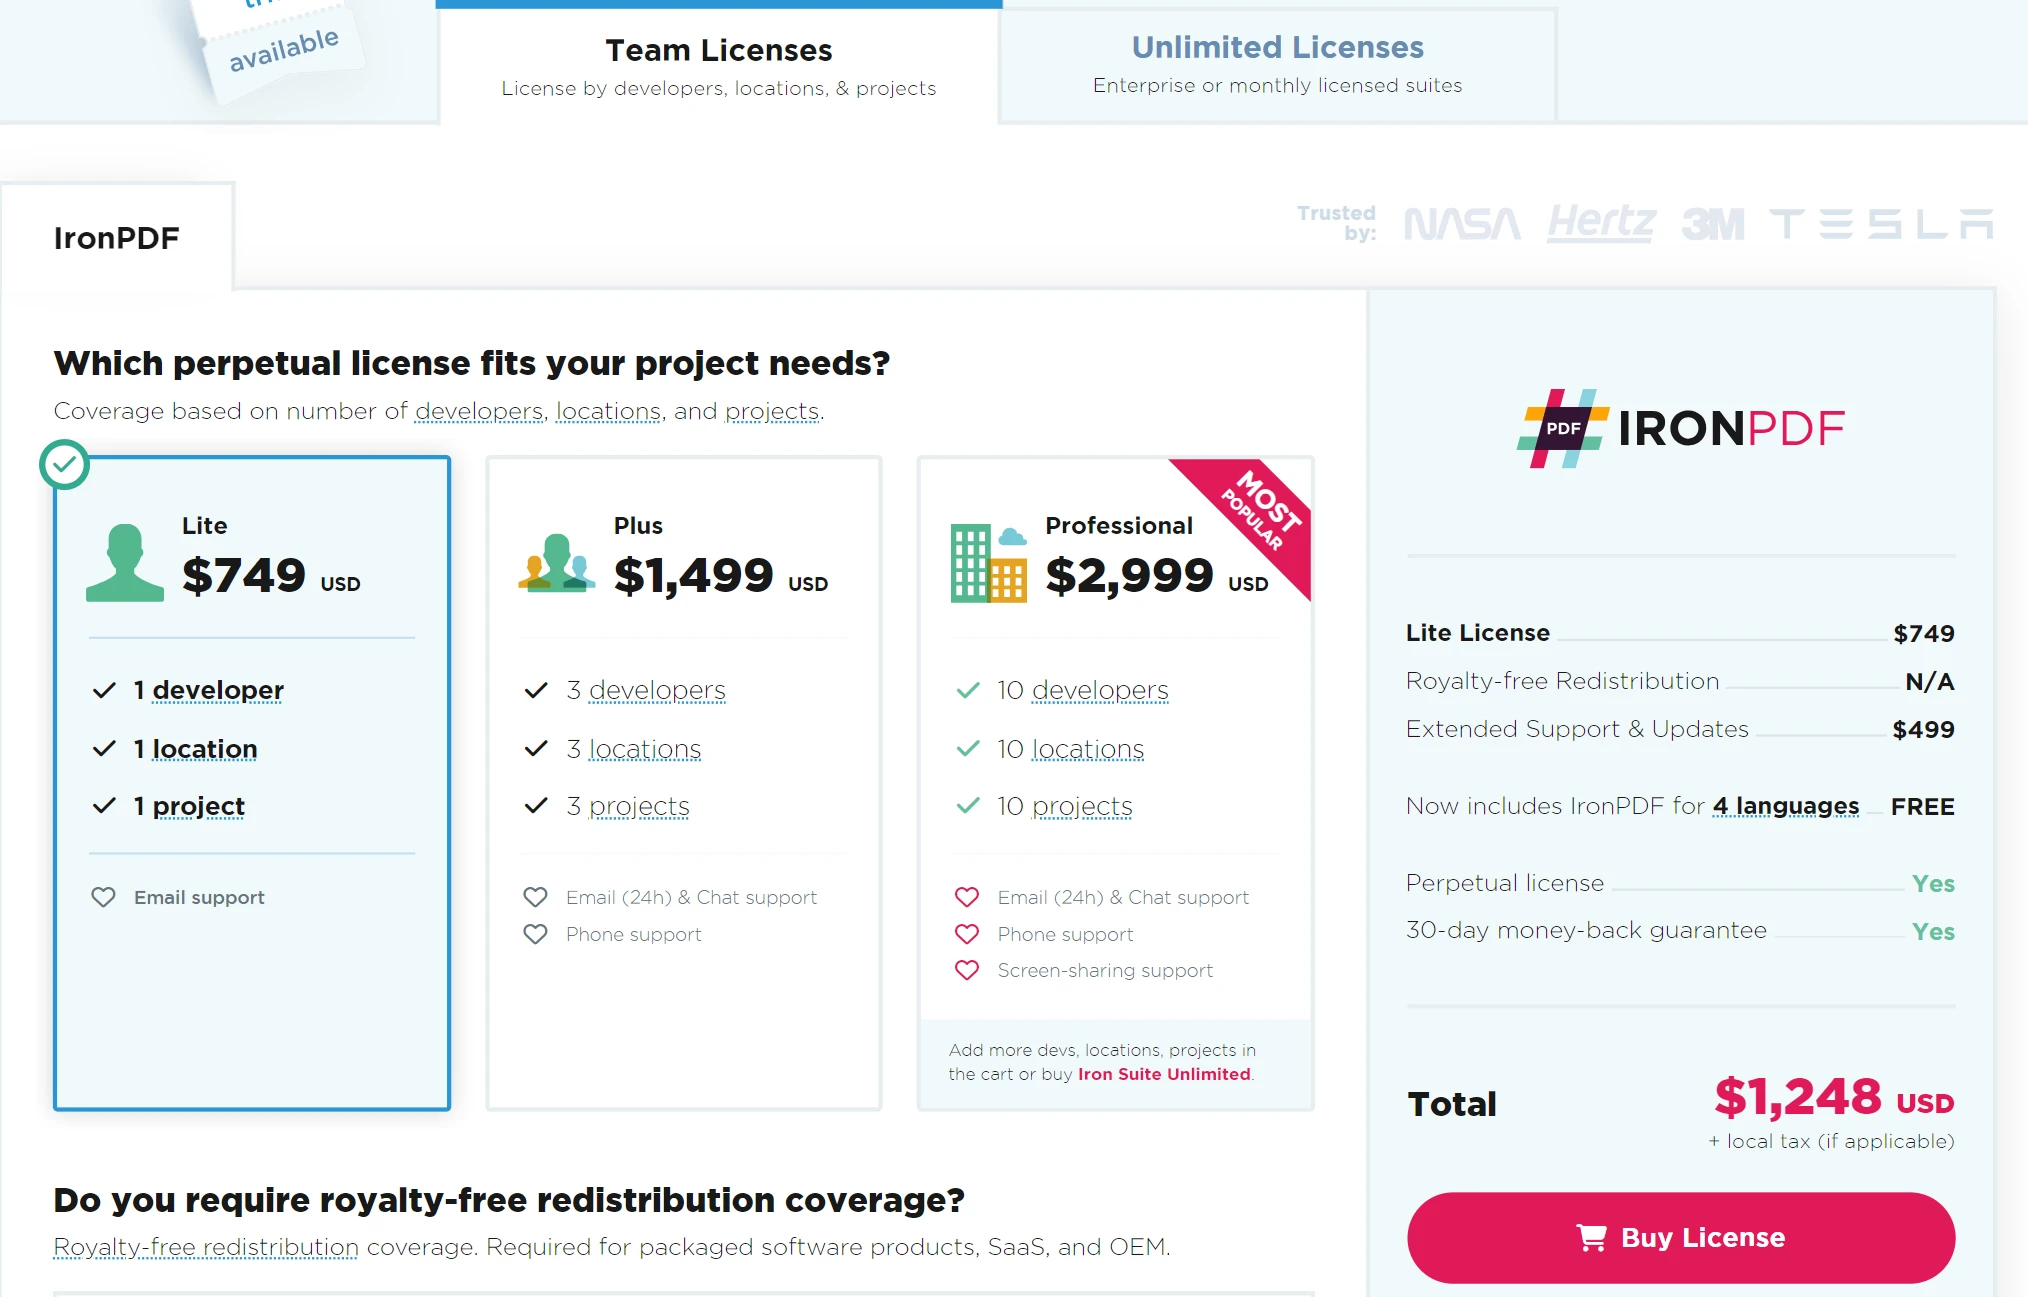
라이선스
워터마크 없이 코드를 사용하려면 라이선스 키가 필요합니다. 이 링크 에서 무료 평가판 라이선스를 등록하실 수 있습니다. 참고로, 신분증명서를 제출하지 않고도 등록할 수 있습니다. 무료 체험판에 등록하려면 이메일 주소만 입력하면 됩니다.
결론
IronPDF 와 igraph의 강력한 기능을 활용하면 복잡한 그래프 데이터를 시각화하고 발표하는 솔루션을 개발할 수 있습니다. igraph를 사용하면 복잡한 네트워크를 쉽게 생성하고 분석할 수 있으며, IronPDF 사용하면 데이터 시각화를 전문가 수준의 PDF 문서로 원활하게 변환할 수 있습니다. 이러한 요소들을 결합하면 그래프 분석과 시각적 표현을 포함한 포괄적인 보고서를 작성하는 데 도움이 될 것입니다.
이러한 통합을 통해 학술 연구, 비즈니스 분석 및 데이터 기반 보고서를 포함하여 포괄적인 네트워크 문서화가 필요한 다양한 애플리케이션 개발이 가능해집니다. 또한, 고품질 문서 출력과 강력한 그래프 조작 기능을 결합했습니다. 뿐만 아니라, Iron Software 다양한 라이브러리를 제공하여 Windows, Android, MAC, Linux 등 다양한 플랫폼 및 운영 체제용 애플리케이션 개발을 더욱 쉽게 만들어 줍니다.