HoloViews Python (How It Works For Developers)
HoloViews is a flexible Python library that makes data visualization simple and intuitive. Through tight integration with the scientific computing stack, it helps users create interactive visualizations with minimal code using various backends such as Matplotlib, Bokeh, or Plotly. The developers designed HoloViews to eliminate manual plotting, making it easy to create interactive, highly customizable visualizations that seamlessly fit into data analysis workflows.
IronPDF is a Python library used to create, edit, and manipulate PDF documents. It allows for HTML to PDF conversions, content edits, security implementations, and the addition of annotations and forms. Integrating HoloViews with IronPDF enables users to embed insightful and interactive data plots into professional PDF reports generated using IronPDF.
This integration particularly benefits data analysts, scientists, business professionals, and individuals who need to effectively and clearly communicate their analysis findings.
What is HoloViews?
The Python module, HoloViews, was developed with ease and elegance in data visualization as primary goals. It uses declarative, high-level syntax, allowing users to focus on what they want to visualize rather than how it's implemented. HoloViews is flexible with any data type and structure and integrates easily with the scientific computing stack and other libraries like Pandas, Dask, or XArray.
HoloViews supports several charting backends, like Matplotlib, Bokeh, and Plotly, enabling easy transitions between different visualization libraries. It is particularly advantageous in exploratory data analyses when creating interactive plots for data annotation.
HoloViews abstracts away complex data visualization challenges, allowing users to transform large datasets into beautiful, meaningful images with minimal coding. Hence, it has become an essential tool for data scientists and analysts.
Features of HoloViews
Declarative Syntax: HoloViews uses high-level declarative syntax that allows users to specify exactly what they want to see, simplifying the creation of complex visualizations.
Native Integration: It natively supports a wide range of data types and structures, integrating seamlessly with libraries within the scientific computing stack, such as Pandas, Dask, and XArray.
External Library Support: Supports a range of libraries, including Matplotlib, Bokeh, and Plotly, allowing users to switch between multiple visualization libraries effortlessly.
Interactivity: Provides interactive plots for dynamic visualization, enabling users to explore and interpret data interactively.
Extensibility: Offers a rich set of options for customizing visualizations and supports multiple backends, allowing users to extend and fine-tune their visualizations as needed.
Ease of Use: The high-level API of HoloViews reduces the required code to create visualizations of large datasets, allowing users to focus more on data analysis rather than the intricacies of charting.
Composability: Users can easily combine simple components into sophisticated visualizations, enabled by the composability feature that focuses on making visualization seamless and simple.
Data Pipelines: Simplifies building intricate workflows for data processing and presentation.
- Rich Ecosystem: As part of the HoloViz ecosystem, HoloViews provides a suite of tools for data visualization and application development and works well with other robust tools in the ecosystem, such as Panel and Datashader.
Create and Configure HoloViews
Install HoloViews and Dependencies
Firstly, download and install HoloViews and all its dependencies with the following pip commands:
pip install holoviews
pip install bokeh
pip install holoviews
pip install bokehUsing HoloViews to Generate Charts
# Import required libraries
import holoviews as hv
from holoviews import opts
import numpy as np

# Initialize HoloViews with Bokeh backend
hv.extension('bokeh')

# Generate data
x = np.linspace(0, 10, 100)
y = np.sin(x)

# Create HoloViews elements with annotated data
line_plot = hv.Curve((x, y), label='Sine Wave').opts(
    title="Line Plot", xlabel="X-axis", ylabel="Y-axis", color='blue'
)

scatter_plot = hv.Scatter((x, y), label='Scatter Plot').opts(
    size=10, color='red', title="Scatter Plot", xlabel="X-axis", ylabel="Y-axis"
)

hist = hv.Histogram(np.histogram(y, bins=20)).opts(
    title="Histogram", xlabel="Value", ylabel="Frequency", color='green'
)

# Combine the HoloViews plots into a layout
layout = (line_plot + scatter_plot + hist).cols(1)

layout.opts(
    opts.Curve(width=400, height=400),
    opts.Scatter(width=400, height=400),
    opts.Histogram(width=400, height=400)
)

# Display layout
layout

# Save visualization layout to an HTML file
hv.save(layout, 'visualization.html', fmt='html')
# Import required libraries
import holoviews as hv
from holoviews import opts
import numpy as np
# Initialize HoloViews with Bokeh backend
hv.extension('bokeh')
# Generate data
x = np.linspace(0, 10, 100)
y = np.sin(x)
# Create HoloViews elements with annotated data
line_plot = hv.Curve((x, y), label='Sine Wave').opts(
title="Line Plot", xlabel="X-axis", ylabel="Y-axis", color='blue'
)
scatter_plot = hv.Scatter((x, y), label='Scatter Plot').opts(
size=10, color='red', title="Scatter Plot", xlabel="X-axis", ylabel="Y-axis"
)
hist = hv.Histogram(np.histogram(y, bins=20)).opts(
title="Histogram", xlabel="Value", ylabel="Frequency", color='green'
)
# Combine the HoloViews plots into a layout
layout = (line_plot + scatter_plot + hist).cols(1)
layout.opts(
opts.Curve(width=400, height=400),
opts.Scatter(width=400, height=400),
opts.Histogram(width=400, height=400)
)
# Display layout
layout
# Save visualization layout to an HTML file
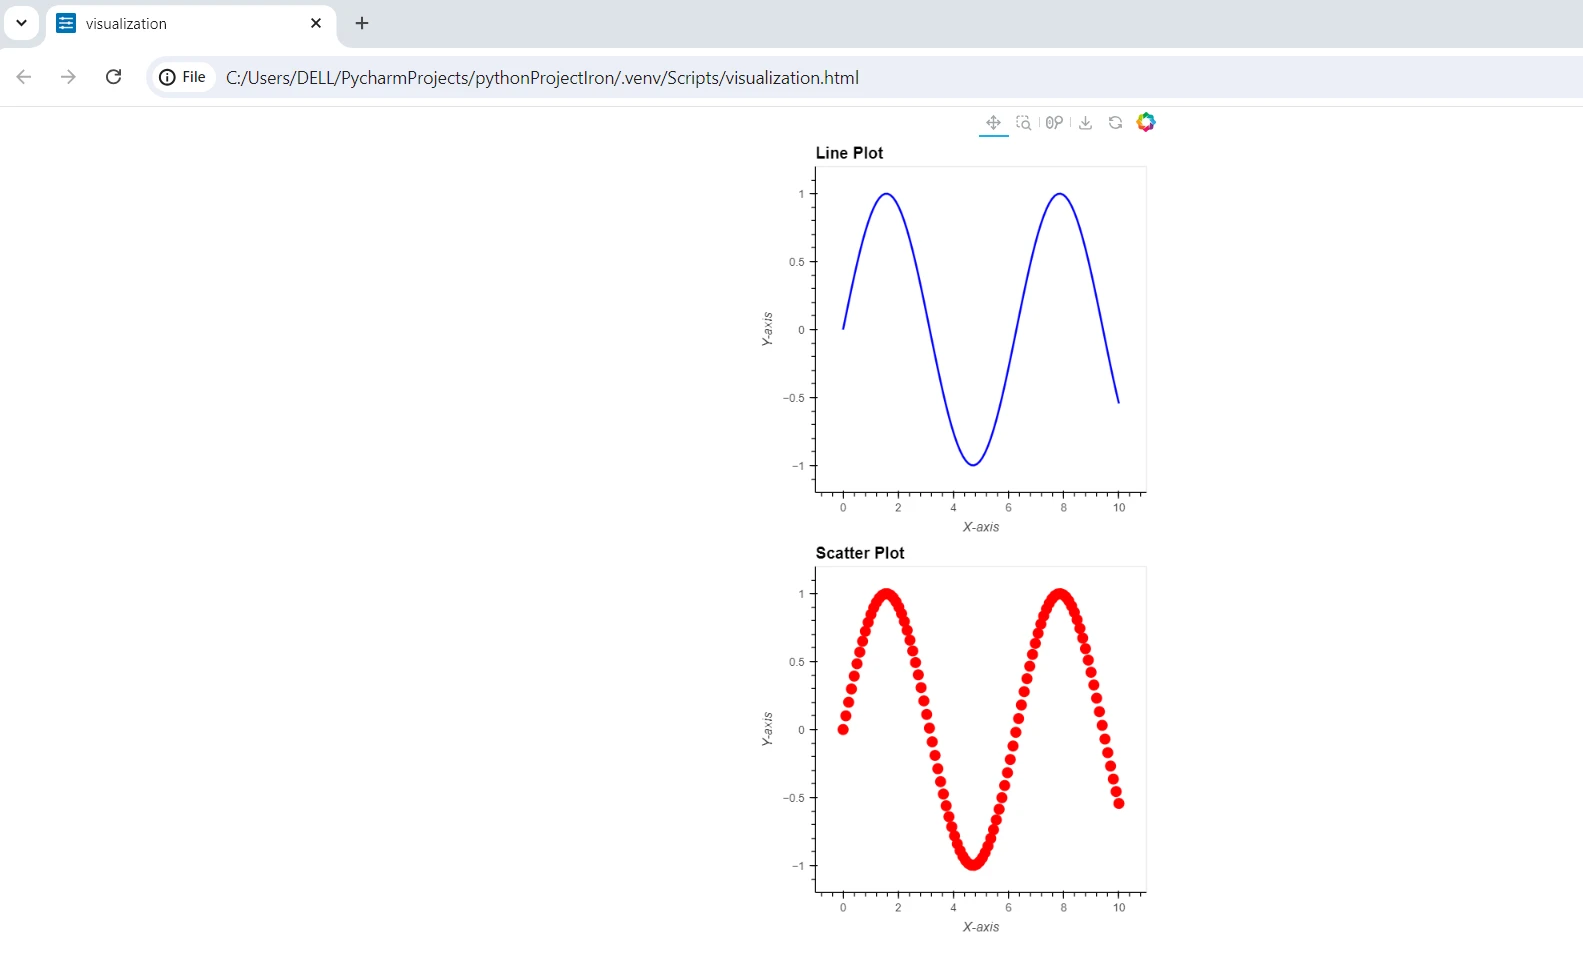
hv.save(layout, 'visualization.html', fmt='html')The code snippet above generates and customizes different graphical elements of data visualizations in HoloViews and composes them into a single layout. We start by importing libraries, initializing HoloViews to use the Bokeh backend for interactive plots, and generating data using NumPy. The dataset consists of an array of values x and their corresponding sine values y.
The script produces three plot types: a line plot of a sine wave, a scatter plot with the data points, and a histogram of the sine value distribution. All charts are customized with titles, axis labels, and coloring using the opts method.
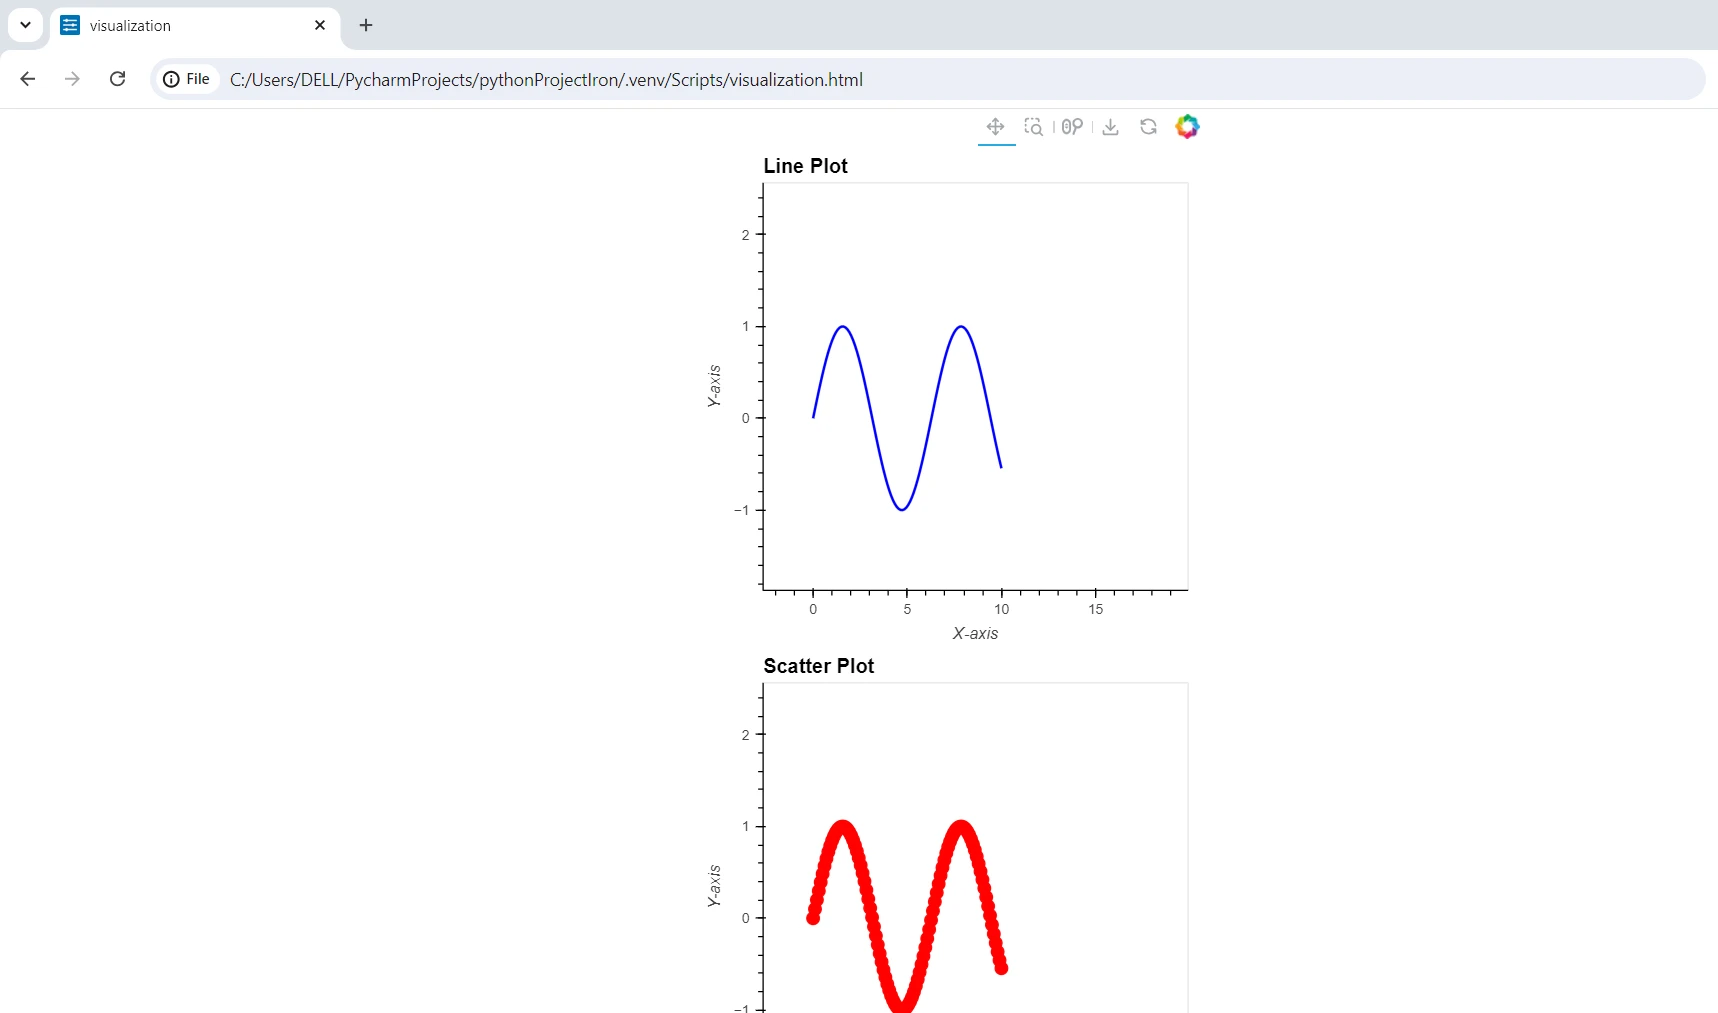
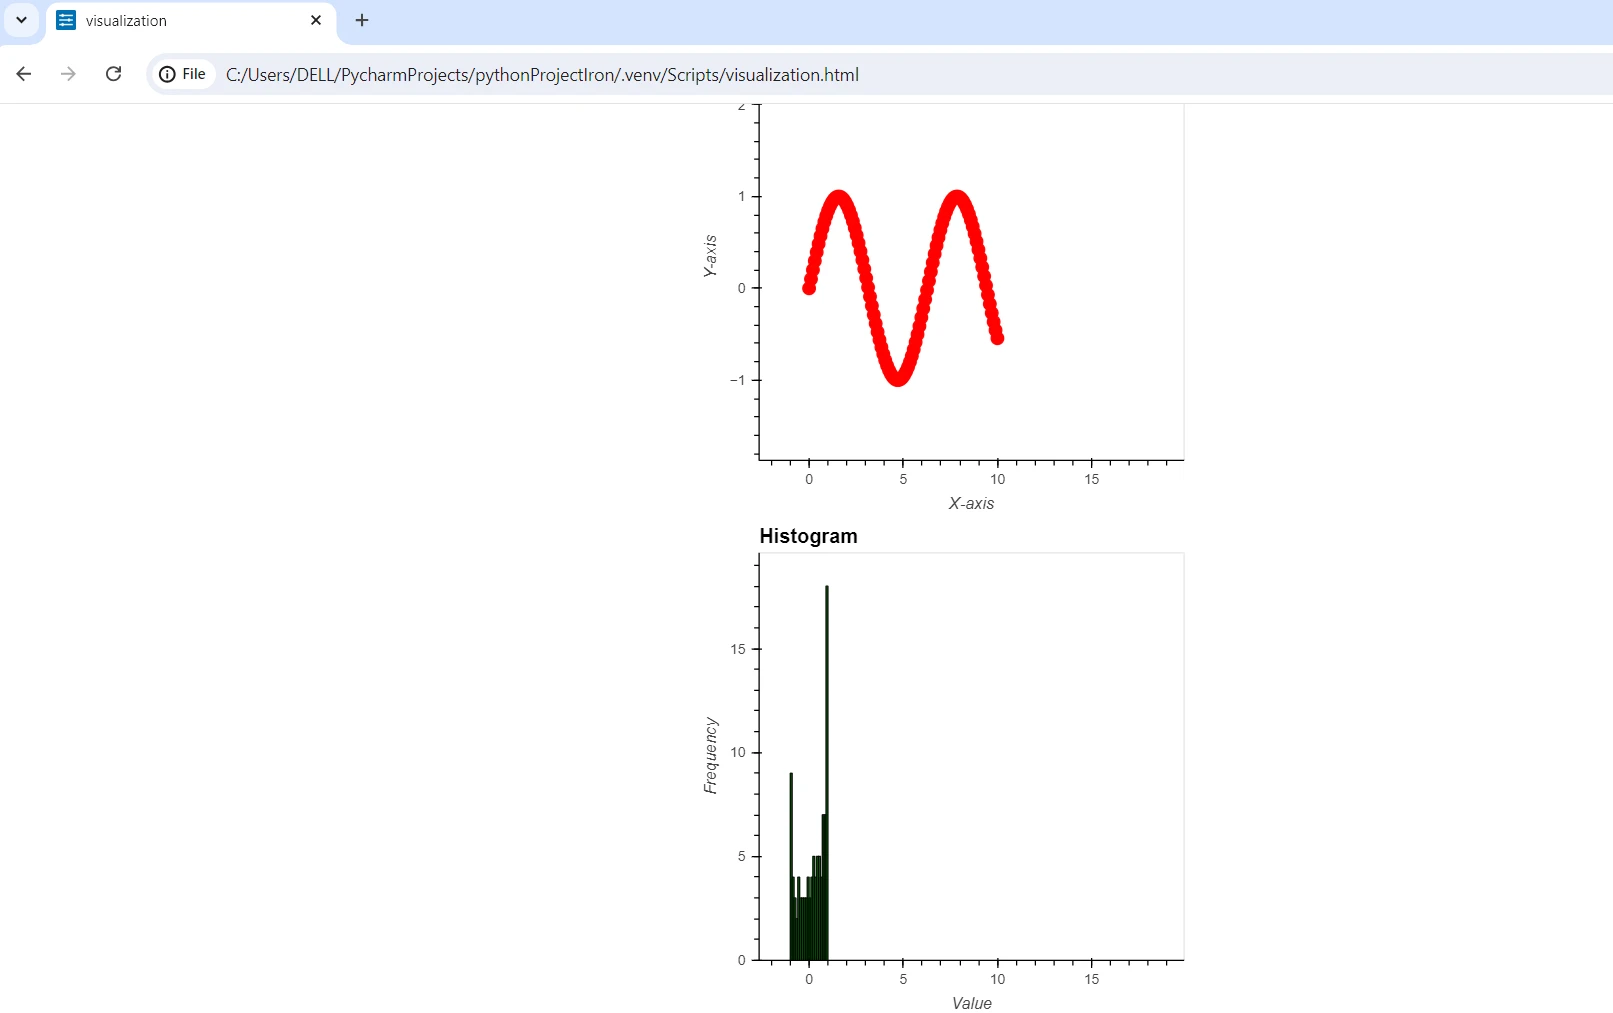
The layout stacks the plots in a single column. After displaying the visualizations, the layout is saved using hv.save as 'visualization.html', demonstrating how easy it is to create and save interactive visualizations with HoloViews.
Combining HoloViews and IronPDF
Now you'll learn how to use HoloViews for data visualization and IronPDF to create PDF documents containing these visualizations. A set of instructions will guide you through installing these libraries, creating visualizations, and generating PDFs from these visualizations using HoloViews and IronPDF.
What is IronPDF?
Using the Python module IronPDF, it is possible to accomplish advanced programmatic tasks within a PDF document. It's a robust, full-featured tool to create, edit, and read PDFs. It maintains the usability of any created and altered PDF documents that were previously made.
IronPDF helps achieve greater compatibility and attractive PDF reports creation, benefitting applications needing to dynamically create and update PDFs. It includes comprehensive documentation with numerous examples to assist users.
HTML to PDF Conversion
Using IronPDF documentation, any HTML data can be transformed into a PDF document swiftly. Users can utilize most of the latest HTML5, CSS3, and Javascript elements to create creative PDF publications directly from web content.
Generate and Edit PDFs
With programming capabilities, you can create new PDF documents containing text, graphics, and tables, among other features. IronPDF allows opening and editing pre-prepared documents, empowering users to add, change, or remove PDF content programmatically.
Complex Design and Styling
Complex layouts with multiple fonts, colors, and design elements are possible due to PDFs' implicit styles. Dynamic content within a PDF, subjected to change, is better rendered in default HTML format instead of JavaScript for simplicity.
Install IronPDF
You can install the IronPDF library via pip using the following command:
pip install ironpdfpip install ironpdfGenerate Charts in PDFs with HoloViews
Here's an example of how to use HoloViews to build simple visualizations:
# Import required libraries
import holoviews as hv
from holoviews import opts
import numpy as np
from ironpdf import ChromePdfRenderer
import warnings

# Suppress warnings
warnings.filterwarnings('ignore')

# Set IronPDF license key (replace with your actual key)
# License.LicenseKey = "your_license_key_here"

# Initialize HoloViews with Bokeh backend
hv.extension('bokeh')

# Generate data
x = np.linspace(0, 10, 100)
y = np.sin(x)

# Create HoloViews elements with annotated data
line_plot = hv.Curve((x, y), label='Sine Wave').opts(
    title="Line Plot", xlabel="X-axis", ylabel="Y-axis", color='blue'
)

scatter_plot = hv.Scatter((x, y), label='Scatter Plot').opts(
    size=10, color='red', title="Scatter Plot", xlabel="X-axis", ylabel="Y-axis"
)

# Combine plots into a layout
layout = (line_plot + scatter_plot).cols(1)

layout.opts(
    opts.Curve(width=400, height=400),
    opts.Scatter(width=400, height=400)
)

# Save visualization layout to an HTML file
hv.save(layout, 'visualization.html', fmt='html')

# Convert the HTML file to PDF using IronPDF
pdf_file_path = 'document.pdf'
html_to_pdf = ChromePdfRenderer()
pdf_document = html_to_pdf.RenderHtmlFileAsPdf('visualization.html')

# Save the PDF
pdf_document.SaveAs(pdf_file_path)
# Import required libraries
import holoviews as hv
from holoviews import opts
import numpy as np
from ironpdf import ChromePdfRenderer
import warnings
# Suppress warnings
warnings.filterwarnings('ignore')
# Set IronPDF license key (replace with your actual key)
# License.LicenseKey = "your_license_key_here"
# Initialize HoloViews with Bokeh backend
hv.extension('bokeh')
# Generate data
x = np.linspace(0, 10, 100)
y = np.sin(x)
# Create HoloViews elements with annotated data
line_plot = hv.Curve((x, y), label='Sine Wave').opts(
title="Line Plot", xlabel="X-axis", ylabel="Y-axis", color='blue'
)
scatter_plot = hv.Scatter((x, y), label='Scatter Plot').opts(
size=10, color='red', title="Scatter Plot", xlabel="X-axis", ylabel="Y-axis"
)
# Combine plots into a layout
layout = (line_plot + scatter_plot).cols(1)
layout.opts(
opts.Curve(width=400, height=400),
opts.Scatter(width=400, height=400)
)
# Save visualization layout to an HTML file
hv.save(layout, 'visualization.html', fmt='html')
# Convert the HTML file to PDF using IronPDF
pdf_file_path = 'document.pdf'
html_to_pdf = ChromePdfRenderer()
pdf_document = html_to_pdf.RenderHtmlFileAsPdf('visualization.html')
# Save the PDF
pdf_document.SaveAs(pdf_file_path)The above code shows how to integrate IronPDF with HoloViews to create visualizations and convert them into PDF documents. Initially, it suppresses warnings and imports the required modules. The code sets up the IronPDF license key, initializes HoloViews with a Bokeh backend for creating interactive visualizations, and generates data using NumPy.
The script creates a line plot and scatter plot with options for color, axis labels, etc., combining them into one column layout (.cols(1)). It saves the HTML file as 'visualization.html' using hv.save(). Then, IronPDF converts the 'visualization.html' into a PDF document with ChromePdfRenderer().RenderHtmlFileAsPdf() and saves it as 'document.pdf' with pdf_document.SaveAs(). This showcases the synergy between HoloViews and IronPDF for converting interactive visualizations into professional PDF reports.
Conclusion
In summary, HoloViews paired with IronPDF provides a robust solution for generating and distributing data-driven visualizations as PDF documents. With a smooth interface with plotting tools like Bokeh and Matplotlib, HoloViews simplifies creating interactive and customized plots. Thus, any data analysis tasks can be easily translated into informative visual reports. IronPDF complements these capabilities by changing visualizations into high-quality PDF documents.
Combined, they empower users to effectively visualize data and share or present findings in an understandable format. By facilitating the journey from data visualization to action, HoloViews and IronPDF enhance productivity and communication across various scenarios, such as academic research, business presentations, data-driven storytelling, and interactive visualization.
IronPDF can be combined with other Iron Software, proving its worth in just days, making the $799 license fee a valuable investment.