igraph python(開發人員如何工作)
圖論和複雜網路研究是電腦科學和數學的基本概念,用於模擬複雜的聯繫和交互作用。 圖的節點(有時也稱為頂點)和邊(有時也稱為連結)本質上只是實體及其關係的視覺表示和解釋,透過連接節點的邊來顯示。
更廣泛地說,用於交通系統、社交網路和通訊網路的所有圖都被視為網路。 透過觀察圖表和網絡,我們可以理解並克服與連通性、流量和網路結構相關的問題。 這項研究為各個領域提供了深入的見解,從社會動態和組織結構到高效能路由和最佳化的演算法。 這些概念在網路理論、運籌學和資料科學中都非常重要。
在本文中,我們將使用 igraph 來展示如何使用靈活可靠的IronPDF庫生成網絡圖並將其列印到 PDF 文件中。
igraph是什麼?
Igraph是一個強大的 Python 包,用於產生、操作和分析複雜的圖和網路。 它提供了一套龐大的圖表處理工具包,涵蓋從圖表生成到圖表操作和視覺化的各個方面。 Python igraph 透過許多演算法計算各種中心性指標、最短路徑、社群結構等等,從而簡化了網路分析的實現。
因此,該庫為有向圖和無向圖提供了良好的視覺化效果,並具有自適應佈局和屬性。 Igraph 非常靈活且速度快,常用於分析複雜的關聯數據,例如數據科學、計算生物學和社會網絡研究等領域。
安裝使用 igraph Python 套件
若要開始學習 Python 中的基本圖論操作和配置,請依照下列步驟建立、設定和使用 igraph。
安裝 igraph 包
您必須先安裝 igraph 套件。可以使用以下 pip 指令進行安裝:
pip install igraphpip install igraph使用 Igraph 建立圖表
這裡有一個簡單的例子,向您展示如何使用 igraph 建立和設定圖:
from igraph import Graph, plot
# Create an empty graph
g = Graph()
# Add vertices (nodes)
g.add_vertices(5) # Adding 5 vertices
# Add edges (connections between vertices)
g.add_edges([(0, 1), (1, 2), (2, 3), (3, 4), (4, 0), (0, 2)]) # Adding edges
# Add vertex ids and edge attributes
g.vs["name"] = ["A", "B", "C", "D", "E"] # Vertex labels
g.es["weight"] = [1, 2, 3, 4, 5, 6] # Edge weights
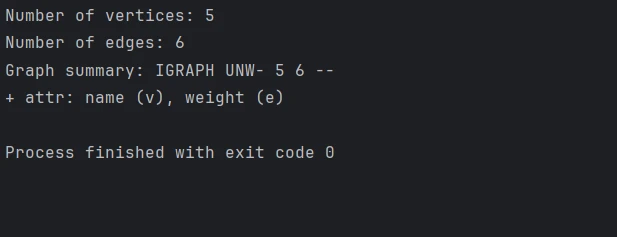
# Print basic graph structural properties
print("Number of vertices:", g.vcount())
print("Number of edges:", g.ecount())
print("Graph summary:", g.summary())from igraph import Graph, plot
# Create an empty graph
g = Graph()
# Add vertices (nodes)
g.add_vertices(5) # Adding 5 vertices
# Add edges (connections between vertices)
g.add_edges([(0, 1), (1, 2), (2, 3), (3, 4), (4, 0), (0, 2)]) # Adding edges
# Add vertex ids and edge attributes
g.vs["name"] = ["A", "B", "C", "D", "E"] # Vertex labels
g.es["weight"] = [1, 2, 3, 4, 5, 6] # Edge weights
# Print basic graph structural properties
print("Number of vertices:", g.vcount())
print("Number of edges:", g.ecount())
print("Graph summary:", g.summary())控制台輸出
配置圖形佈局和視覺化
我們可以使用 igraph 的一些內建功能來繪製圖形。 使用以下方法變更外觀和佈局:
# Define a layout for the graph
layout = g.layout("circle")  # Layout in a circular arrangement

# Plot the graph with labels and custom options
plot(
    g,
    layout=layout,
    vertex_label=g.vs["name"],  # Label vertices
    vertex_color="lightblue",   # Vertex color
    edge_width=g.es["weight"],  # Edge width based on weight
    vertex_size=30,             # Vertex size
    edge_color="grey",          # Edge color
    bbox=(300, 300),            # Size of the plot
    margin=20                   # Margin around the plot
)

# Save the plotted graph to a file
plot(g, layout=layout, bbox=(300, 300), margin=20).save('exampleGraph.png')
# Define a layout for the graph
layout = g.layout("circle") # Layout in a circular arrangement
# Plot the graph with labels and custom options
plot(
g,
layout=layout,
vertex_label=g.vs["name"], # Label vertices
vertex_color="lightblue", # Vertex color
edge_width=g.es["weight"], # Edge width based on weight
vertex_size=30, # Vertex size
edge_color="grey", # Edge color
bbox=(300, 300), # Size of the plot
margin=20 # Margin around the plot
)
# Save the plotted graph to a file
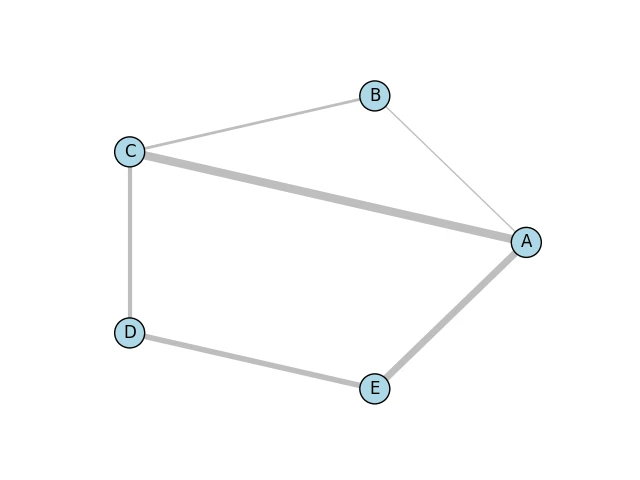
plot(g, layout=layout, bbox=(300, 300), margin=20).save('exampleGraph.png') 輸出圖表
下面這張簡單的圖形影像是藉助 Matplotlib 函式庫和 Cairo 函式庫的 Python 綁定產生的。
進階圖操作
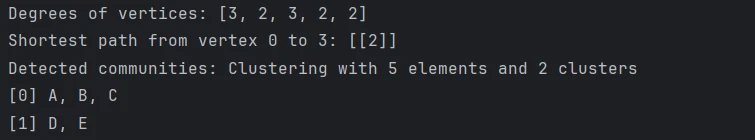
執行各種圖表操作和分析,例如計算中心性、尋找社群或確定最短路徑:
# Calculate degree centrality for each vertex
degrees = g.degree()
print("Degrees of vertices:", degrees)

# Compute shortest path between two vertices that don't have a predefined distance
shortest_path = g.shortest_paths_dijkstra(source=0, target=3)
print("Shortest path from vertex 0 to 3:", shortest_path)

# Detect communities using the Louvain method
communities = g.community_multilevel()
print("Detected communities:", communities)
# Calculate degree centrality for each vertex
degrees = g.degree()
print("Degrees of vertices:", degrees)
# Compute shortest path between two vertices that don't have a predefined distance
shortest_path = g.shortest_paths_dijkstra(source=0, target=3)
print("Shortest path from vertex 0 to 3:", shortest_path)
# Detect communities using the Louvain method
communities = g.community_multilevel()
print("Detected communities:", communities)控制台輸出
IronPDF簡介
我們甚至可以使用IronPDF Python 模組以程式方式產生和編輯 PDF 文件。 使用此程式庫,您將擁有強大的功能,可以從 HTML 建立 PDF 文檔,合併兩個或多個 PDF 文檔,甚至可以使用現有的 PDF 並對其進行修改,以添加文字、照片和註釋。 IronPDF可讓您從任何 HTML 網站或 Web 內容產生專業品質的 PDF,適用於產生具有預設樣式的報表、發票和其他文件。
它的一些高級功能包括編輯頁面佈局、文件加密和從 PDF 中提取文字。 如果開發人員能夠更好地處理 PDF 文件,這將有助於他們更好地提升產品的整體實用性。
安裝IronPDF庫
您可以使用以下命令安裝允許 Python 介面為您的專案啟用IronPDF功能的軟體包:
pip install ironpdf
將 igraph 與IronPDF集成
以下是使用 Python 合併 igraph 和IronPDF 的步驟:首先,使用 igraph 建立一個圖表並將其顯示出來。 然後,將產生的視覺化結果轉換為 PDF 檔案。
from igraph import Graph, plot
import matplotlib.pyplot as plt
from ironpdf import ImageToPdfConverter, License
import warnings

# Suppress warnings for cleaner output
warnings.filterwarnings('ignore')

# Ensure that you have replaced the string with your own license key
License.LicenseKey = "YOUR LICENSE KEY GOES HERE"

# Create an empty graph
g = Graph()

# Add adjacent vertices (nodes)
g.add_vertices(5)  # Adding 5 vertices

# Add edges (connections between vertices)
g.add_edges([(0, 1), (1, 2), (2, 3), (3, 4), (4, 0), (0, 2)])  # Adding edges

# Add vertex and edge attributes
g.vs["name"] = ["A", "B", "C", "D", "E"]  # Vertex labels
g.es["weight"] = [1, 2, 3, 4, 5, 6]  # Edge weights

# Define a layout for the graph
layout = g.layout("circle")  # Layout in a circular arrangement

# Create a plot using matplotlib
fig, ax = plt.subplots()

# Plot the graph with specified layout and styles
plot(
    g,
    target=ax,
    layout=layout,
    vertex_label=g.vs["name"],  # Label vertices
    vertex_color="lightblue",   # Vertex color
    edge_width=g.es["weight"],  # Edge width based on weight
    vertex_size=30,             # Vertex size
    edge_color="grey",          # Edge color
    bbox=(300, 300),            # Size of the plot
    margin=20                   # Margin around the plot
)

# Save the plot as a PNG image
plt.savefig('result.png')

# Convert the image to a PDF file
ImageToPdfConverter.ImageToPdf('result.png').SaveAs("result.pdf")
from igraph import Graph, plot
import matplotlib.pyplot as plt
from ironpdf import ImageToPdfConverter, License
import warnings
# Suppress warnings for cleaner output
warnings.filterwarnings('ignore')
# Ensure that you have replaced the string with your own license key
License.LicenseKey = "YOUR LICENSE KEY GOES HERE"
# Create an empty graph
g = Graph()
# Add adjacent vertices (nodes)
g.add_vertices(5) # Adding 5 vertices
# Add edges (connections between vertices)
g.add_edges([(0, 1), (1, 2), (2, 3), (3, 4), (4, 0), (0, 2)]) # Adding edges
# Add vertex and edge attributes
g.vs["name"] = ["A", "B", "C", "D", "E"] # Vertex labels
g.es["weight"] = [1, 2, 3, 4, 5, 6] # Edge weights
# Define a layout for the graph
layout = g.layout("circle") # Layout in a circular arrangement
# Create a plot using matplotlib
fig, ax = plt.subplots()
# Plot the graph with specified layout and styles
plot(
g,
target=ax,
layout=layout,
vertex_label=g.vs["name"], # Label vertices
vertex_color="lightblue", # Vertex color
edge_width=g.es["weight"], # Edge width based on weight
vertex_size=30, # Vertex size
edge_color="grey", # Edge color
bbox=(300, 300), # Size of the plot
margin=20 # Margin around the plot
)
# Save the plot as a PNG image
plt.savefig('result.png')
# Convert the image to a PDF file
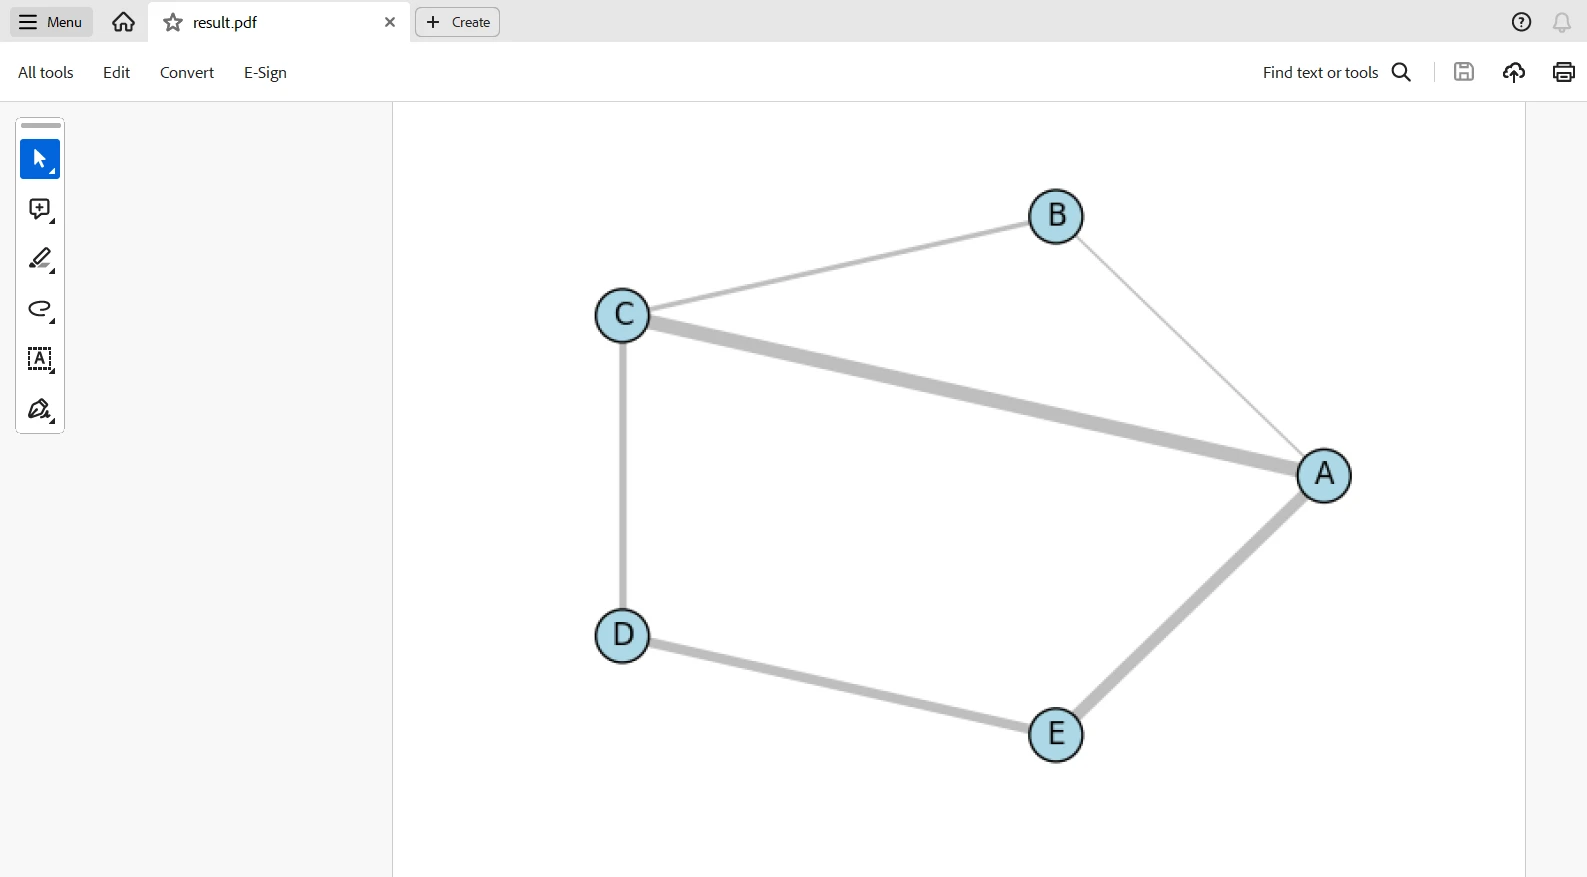
ImageToPdfConverter.ImageToPdf('result.png').SaveAs("result.pdf")該腳本將透過 igraph 產生圖表,使用 matplotlib 進行視覺化,然後使用IronPDF將圖表轉換為 PDF。 這段程式碼將導入所有必要的庫,並使用許可證密鑰設定IronPDF 。 創建一個有五個頂點和六個邊的空圖,並添加權重和標籤以使其更清晰。
此圖呈現圓形佈局,繪圖使用了 matplotlib,並設定了頂點顏色和大小、邊線寬度等多種視覺化屬性。 之後,結果以圖像檔案的形式保存,result.png。 最後,使用 IronPDF 的ImageToPdfConverter將其轉換為 PDF,result.pdf。 圖表建立、視覺化和 PDF 生成被整合到一個工作流程中。
輸出的PDF
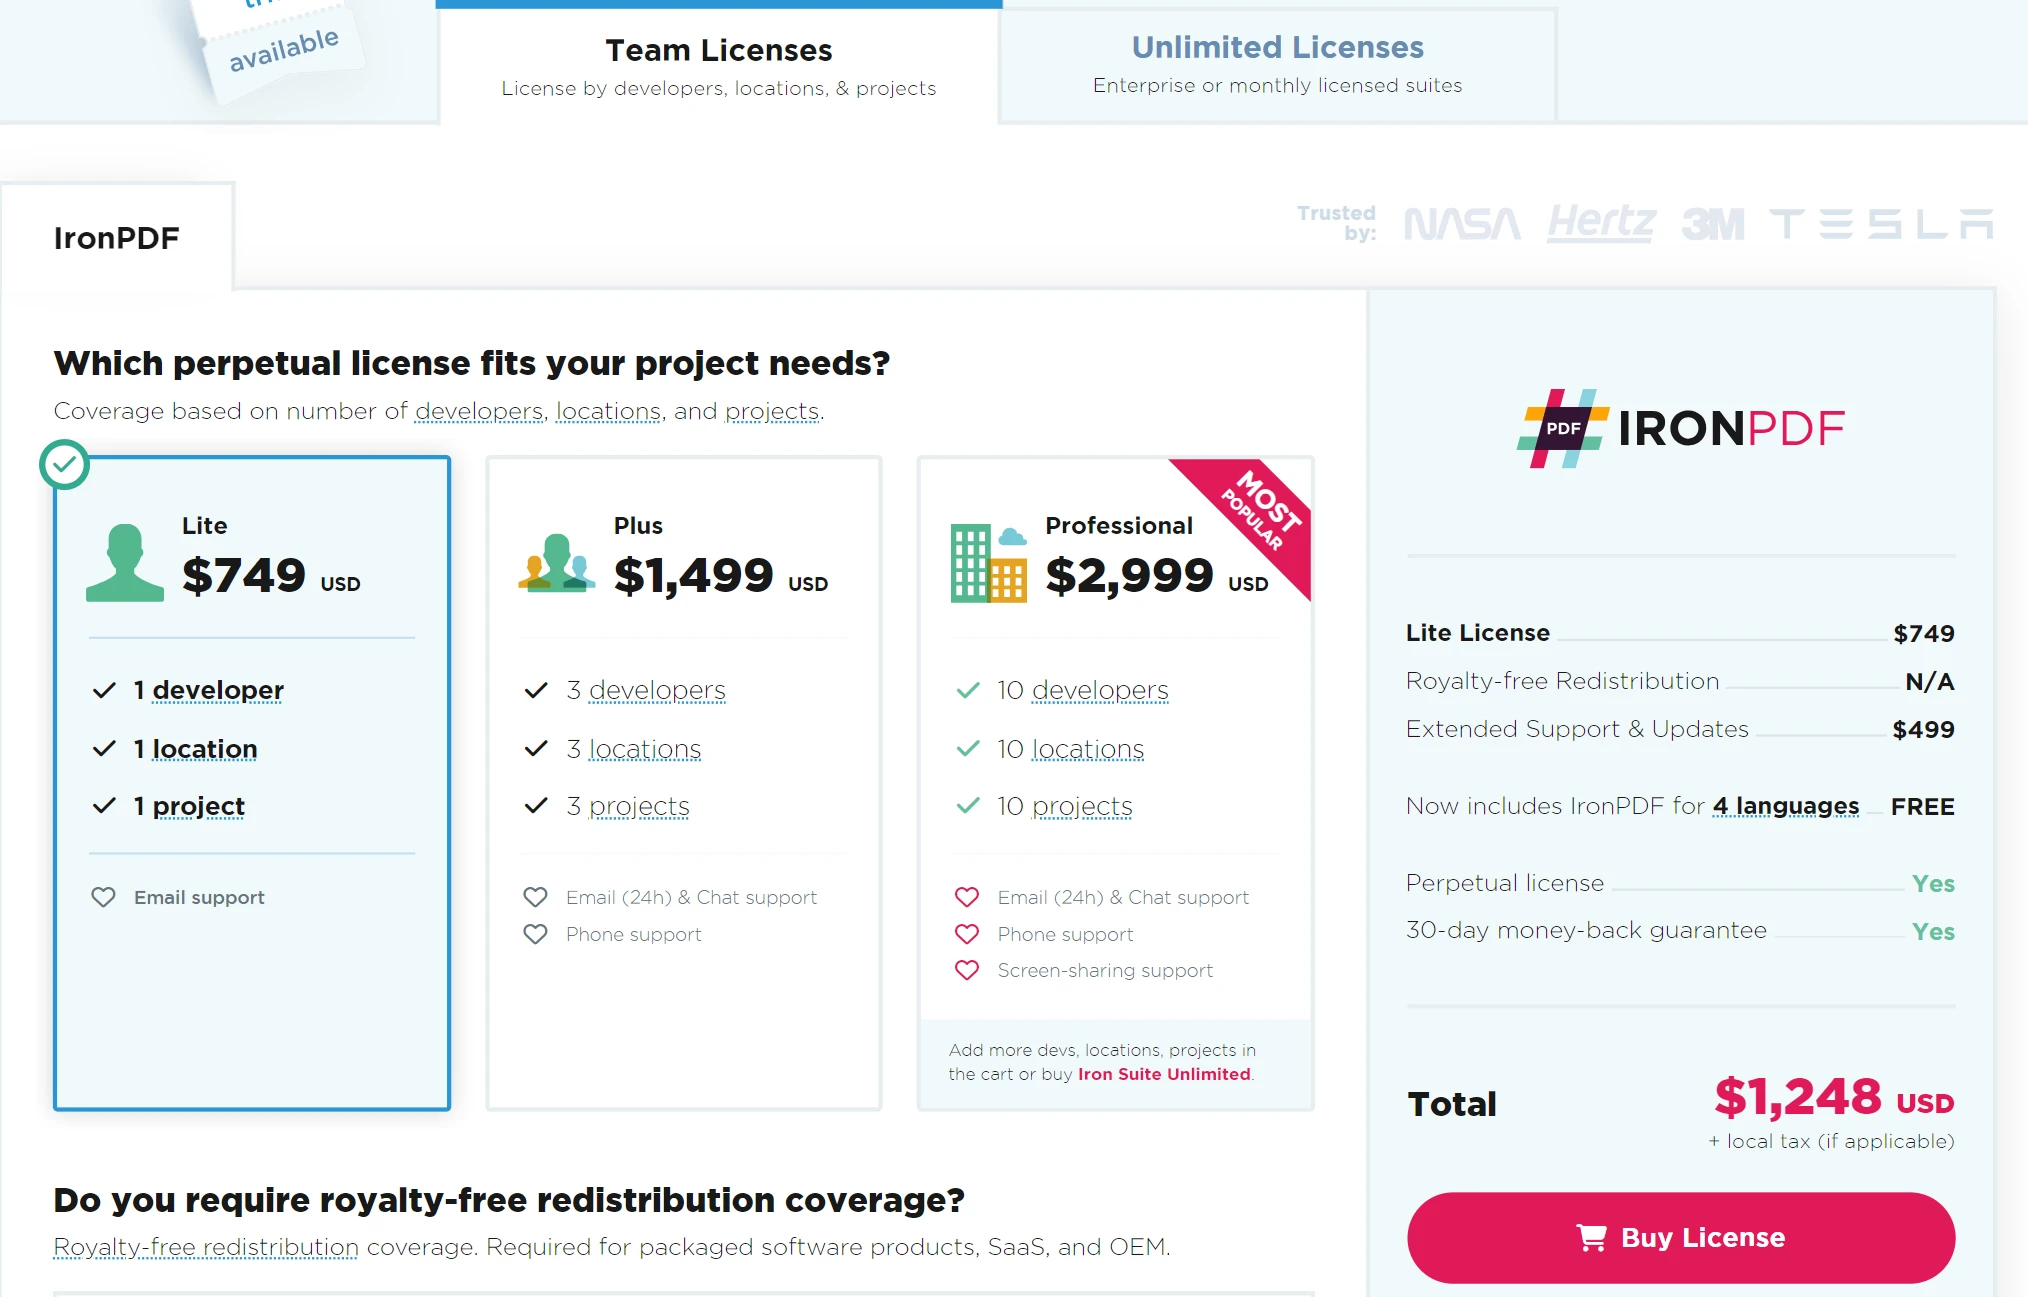
授權
需要許可證密鑰才能使程式碼在不顯示浮水印的情況下運作。 您可以透過此連結註冊免費試用許可證。 請注意,您無需提供身份證明即可註冊。 註冊免費試用版只需輸入您的電子郵件地址即可。
結論
透過IronPDF和 igraph 的強大功能,您可以開發用於視覺化和呈現複雜圖形資料的解決方案。 透過 igraph,您可以輕鬆建立和分析複雜的網絡,同時使用IronPDF將資料視覺化無縫轉換為專業級 PDF 文件。 這些綜合力量將幫助您編制全面的報告,包括圖表分析和視覺化表示。
這種整合使得開發各種需要全面網頁文件的應用成為可能,包括學術研究、商業分析和資料驅動型報告。 此外,它還兼具高品質的文件輸出和強大的圖表處理功能。更重要的是, Iron Software提供豐富的函式庫,讓開發適用於 Windows、Android、macOS、Linux 等多種平台和作業系統的應用程式變得更加容易。