Using Bokeh for Data Visualization in Python
The creation of interactive visualizations and their embedding into high-quality PDF publications can be accomplished with ease by integrating Bokeh Python with IronPDF for Python.
Easily shareable and embeddable into online apps, Bokeh is a robust Python framework for making high-quality, interactive infographics. In-depth data analysis and presentation can be greatly aided by the complicated graphs it can create, like bubble charts, box plots, and charts with error bars.
IronPDF is primarily a .NET library, but you can use it to enhance its capability. Through the utilization of Bokeh for visual representation and IronPDF for PDF generation, users can effectively include intricate and dynamic visual data into static PDF reports.
Creating visualizations with Bokeh, exporting these plots as images, and then using IronPDF to embed these images into PDF documents make up this integration procedure. This method combines the finest features of static document generation with interactive visualizations to enable data scientists, analysts, and developers to create comprehensive, aesthetically rich reports that are simple to distribute and review.
What is Bokeh Python?
Bokeh Python offers a powerful plotting interface with its plotting import figure module, enabling users to create a wide range of interactive data visualizations. Its flexibility extends to layout management, where layouts import row and layouts import gridplot facilitates the arrangement of multiple plots seamlessly.
As an interactive visualization library optimized for modern web browsers, Bokeh renders stunning bokeh plotting that dynamically responds to user interactions. From simple line charts to complex bar charts, Bokeh excels in conveying data points with clarity and precision, making it an invaluable tool for interactive data visualization, exploration, and presentation.
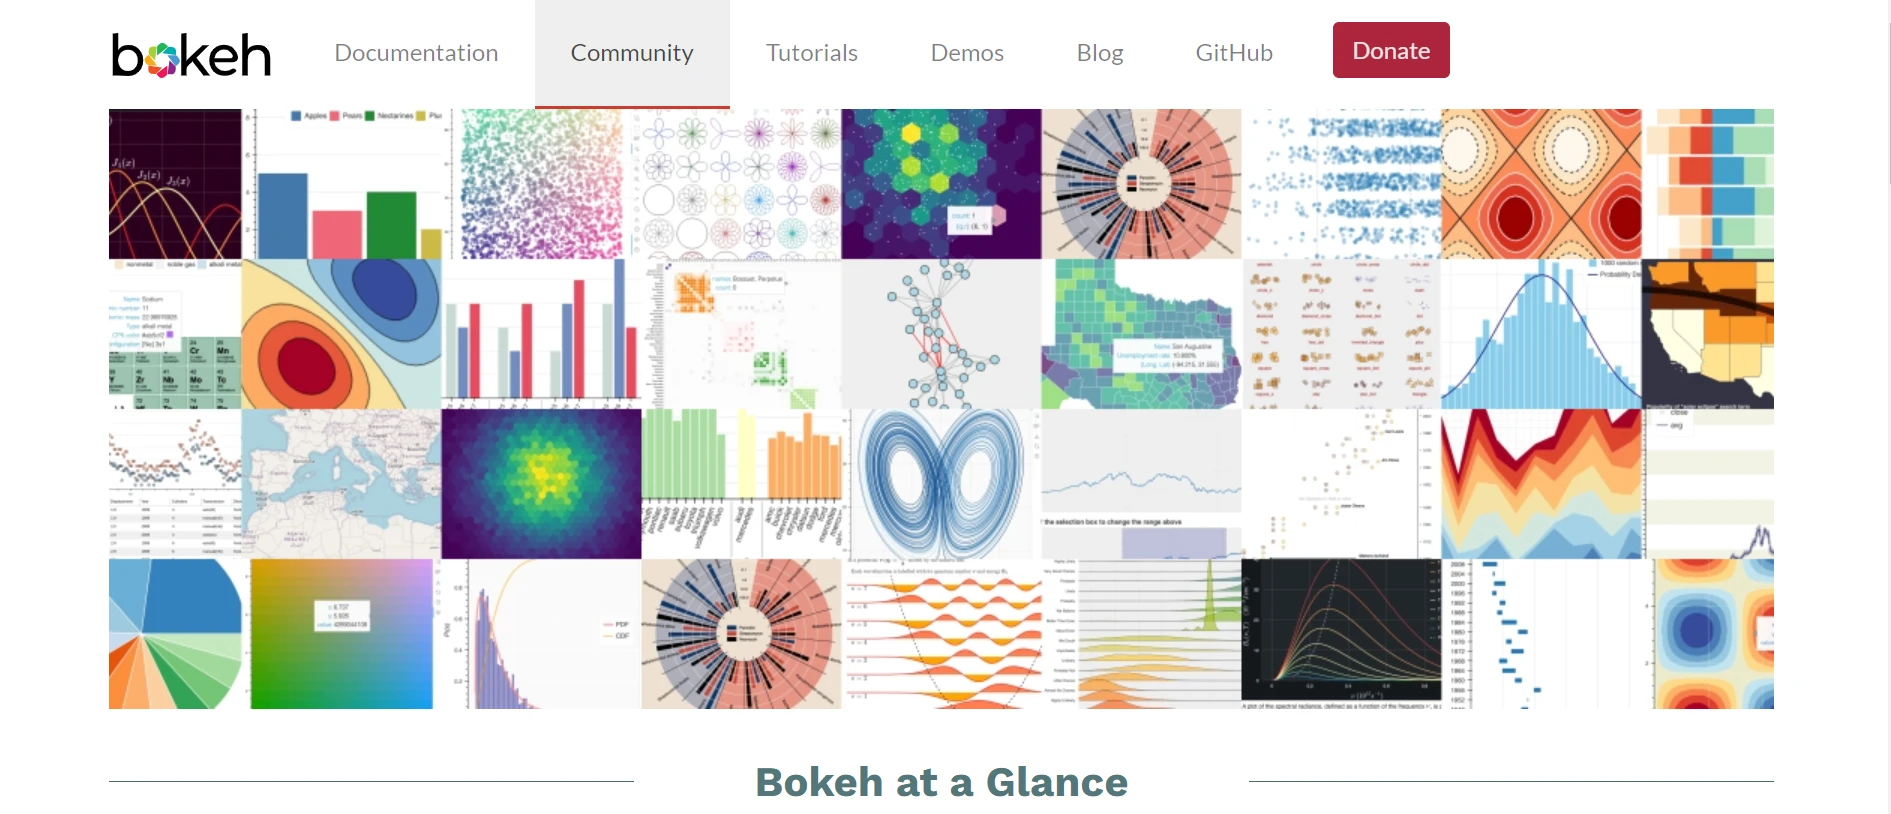
Bokeh is appropriate for a variety of data science and visualization jobs because of its broad selection of plot styles, which include line charts, bar charts, scatter plots, box plots, bubble charts, and charts with error bars. Because of the library's high degree of customization, users can alter plot elements like colors, labels, and legends to produce visually appealing and educational images.
Interactive Plots
Bokeh makes it possible to create interactive charts that let users explore data in greater depth by zooming, panning, and hovering over them. For deeper insights and data research, or even if you just want to plot publicly available data, this interactivity is essential.
High-Quality Visuals
Bokeh creates visually stunning and high-quality visualizations that are appropriate for publication and presentation. The images are intended to be both educational and aesthetically pleasing.
Customization
Bokeh provides a wide range of plot customization choices. Plot elements, colors, labels, and other features are all adjustable by the user, enabling customized and accurate displays.
Server-Side Interactivity
Bokeh comes with an integrated Bokeh server that lets you create dynamic dashboards and online apps. This capability is perfect for dynamic data visualization needs because it allows for real-time data streaming and updating.
Integration with Web Technologies
Bokeh visualizations can be exported as stand-alone HTML files or integrated into web apps. Sharing interactive visualizations on the internet is made simple by this connection.
Widgets and Layouts
Bokeh facilitates the production of intricate layouts and interactive widgets (such as dropdown menus and sliders) that allow for the creation of sophisticated data dashboards and apps.
Large Dataset Handling
Big datasets can be handled effectively by Bokeh. Even with large volumes of data, it makes use of effective rendering algorithms to maintain the responsiveness and interactivity of the visualizations.
Create and Configure Bokeh Python
From installation to interactive plot generation, there are multiple steps involved in setting up and configuring Bokeh in Python.
Install Bokeh
You must install the Bokeh library first. Pip can be used for this:
pip install bokehpip install bokehImport Bokeh Libraries
After installing Bokeh, you must import the required parts from Bokeh.
from bokeh.plotting import figure, output_file, showfrom bokeh.plotting import figure, output_file, showPrepare Data and Create a Plot
Get the information ready for visualization. This data may be presented as Pandas DataFrames, NumPy arrays, or lists. The figure function in Bokeh can be used to make a new plot. Plot customization includes changing the plot's labels, titles, and other details.
# Sample data
x = [1, 2, 3, 4, 5]
y = [6, 7, 2, 4, 5]

# Create a Bokeh figure
p = figure(title="Simple Bokeh Plot", x_axis_label='X-Axis', y_axis_label='Y-Axis')
# Sample data
x = [1, 2, 3, 4, 5]
y = [6, 7, 2, 4, 5]
# Create a Bokeh figure
p = figure(title="Simple Bokeh Plot", x_axis_label='X-Axis', y_axis_label='Y-Axis')Add Renderers
To depict your data, add renderers (such as lines, circles, and bars) to the plot.
# Add a line renderer
p.line(x, y, legend_label="Line Example", line_width=2)
# Add a line renderer
p.line(x, y, legend_label="Line Example", line_width=2)Configure Output
Indicate the desired output location for the plot. It can be seen inline or exported to a file.
# Output to an HTML file
output_file("bokeh_plot.html")
# Output to an HTML file
output_file("bokeh_plot.html")Show the Plot
Use the display function to render the Bokeh plots.
# Show the plot
show(p)
# Show the plot
show(p)Getting Started
Creating interactive visualizations using Bokeh, exporting them as static photos, and then producing a PDF document with these images are the steps involved in integrating Bokeh with IronPDF in Python. We will utilize the Python library IronPDF to build the PDF document.
What is IronPDF?
Use the robust IronPDF for Python library to create, modify, and convert PDF files. It enables programmers to work with existing PDFs, convert HTML to PDFs, and carry out various programming-based tasks associated with PDFs. IronPDF offers an adjustable and user-friendly way to create high-quality PDF documents, making it a useful solution for applications that require dynamic PDF generation and processing.
Convert HTML to PDF
You can use IronPDF to convert HTML information to PDF documents. This allows leveraging contemporary HTML5, CSS3, and JavaScript to create visually appealing PDF publications from web content.
PDF Creation and Editing
Programmatically created new PDF documents can have text, images, tables, and other material added to them. IronPDF allows you to open and edit existing PDF documents. You can add to or modify the content of the PDF, as well as remove specific sections.
Advanced Styling and Layout
Use CSS to style the content in PDFs. This includes support for complex layouts, fonts, colors, and other design elements. Create dynamic material in PDFs by rendering HTML content that may be used with JavaScript.
Install IronPDF
Pip can be used to install IronPDF. To install it, use the following command:
pip install ironpdfpip install ironpdfGenerate PDF Document with Bokeh Charts
Make a chart by utilizing Bokeh. Let's make a basic line chart to illustrate this.
# Step 1: Import Bokeh Libraries
from bokeh.plotting import figure, output_file, show

# Step 2: Import the IronPDF library
from ironpdf import ChromePdfRenderer

# Prepare Your Data
x = [1, 2, 3, 4, 5]
y = [6, 7, 2, 4, 5]

# Create a Plot
p = figure(title="Simple Bokeh Plot", x_axis_label='X-Axis', y_axis_label='Y-Axis')

# Add a line renderer to the plot
p.line(x, y, legend_label="Line Example", line_width=2)

# Configure output to an HTML file
output_file("bokeh_plot.html")

# Show the plot (optional)
show(p)

# Step 3: Instantiate a PDF renderer
iron_pdf = ChromePdfRenderer()

# Render HTML content to the PDF
pdf = iron_pdf.RenderHtmlFileAsPdf("bokeh_plot.html")

# Save the generated PDF to a file
pdf.SaveAs("BokehPlot.pdf")

print("PDF document generated successfully.")
# Step 1: Import Bokeh Libraries
from bokeh.plotting import figure, output_file, show
# Step 2: Import the IronPDF library
from ironpdf import ChromePdfRenderer
# Prepare Your Data
x = [1, 2, 3, 4, 5]
y = [6, 7, 2, 4, 5]
# Create a Plot
p = figure(title="Simple Bokeh Plot", x_axis_label='X-Axis', y_axis_label='Y-Axis')
# Add a line renderer to the plot
p.line(x, y, legend_label="Line Example", line_width=2)
# Configure output to an HTML file
output_file("bokeh_plot.html")
# Show the plot (optional)
show(p)
# Step 3: Instantiate a PDF renderer
iron_pdf = ChromePdfRenderer()
# Render HTML content to the PDF
pdf = iron_pdf.RenderHtmlFileAsPdf("bokeh_plot.html")
# Save the generated PDF to a file
pdf.SaveAs("BokehPlot.pdf")
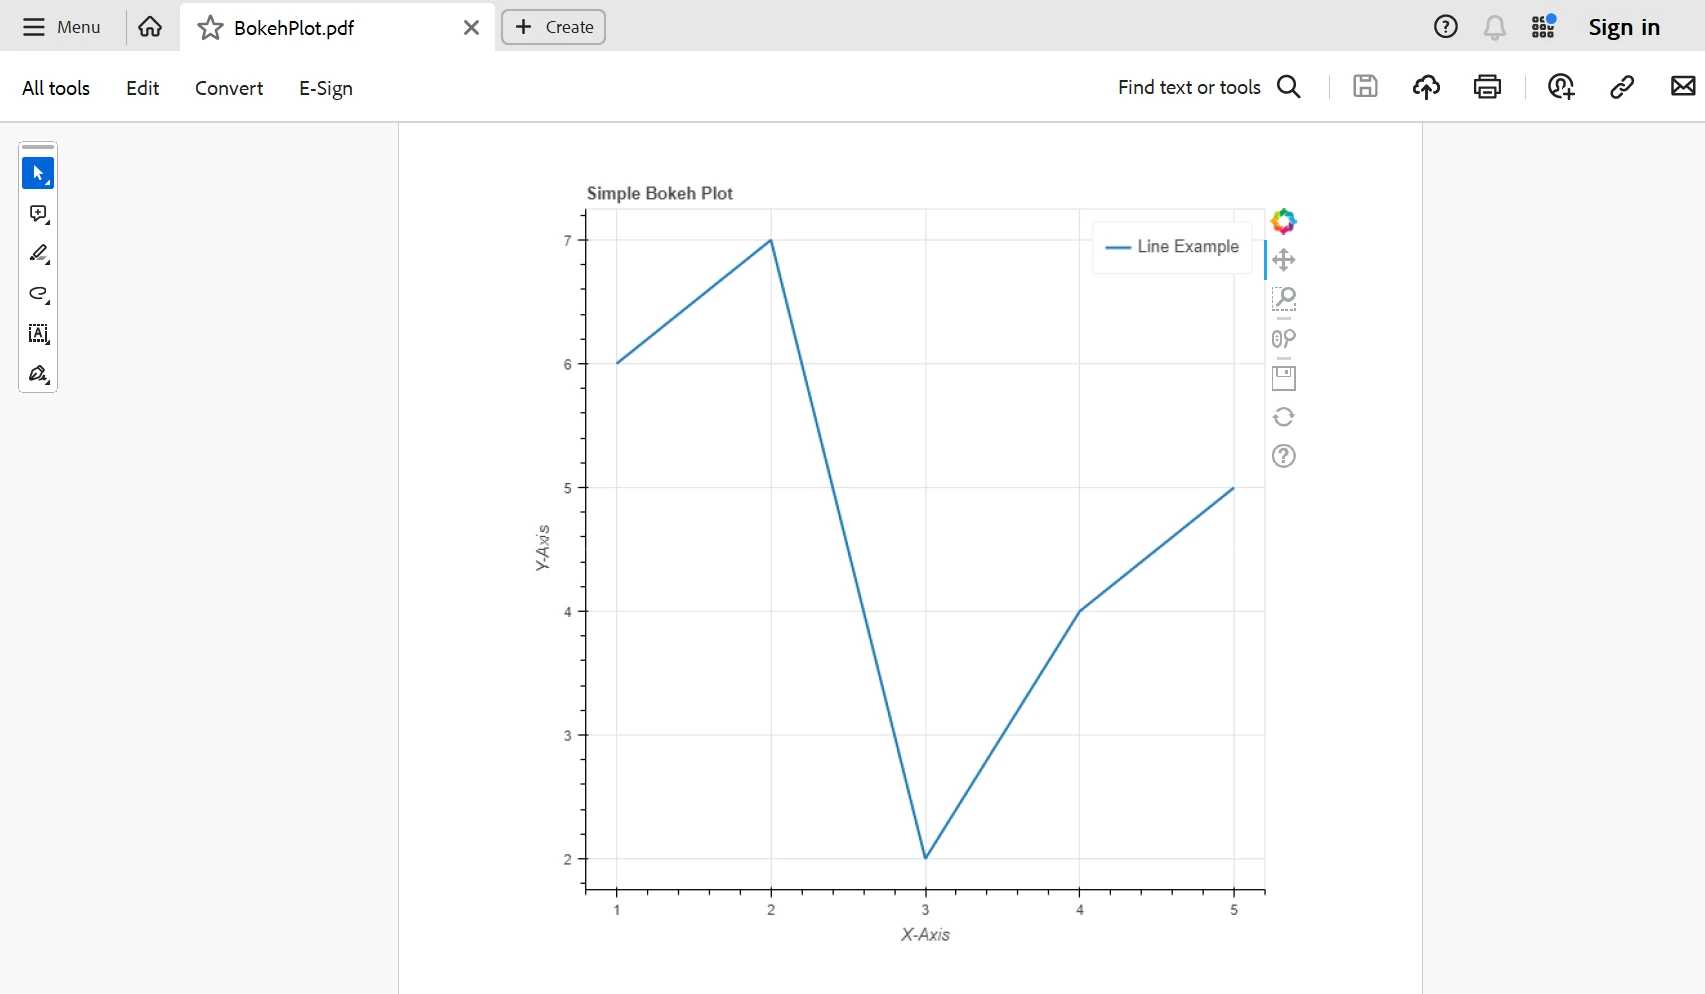
print("PDF document generated successfully.")Here, we import Bokeh's required functions first. Establish the plot's sample data values and produce a Bokeh figure with axis labels and a title. We then use p.line() to add a line renderer to the plot. The output_file() function is imported from Bokeh to specify the output file name for the HTML representation of the plot.
Next, from IronPDF, we import the ChromePdfRenderer class, which is used for rendering the HTML file as a PDF. We instantiate the IronPDF renderer and use the RenderHtmlFileAsPdf() method to convert the HTML file into a PDF. Lastly, we save the generated PDF using the SaveAs() method.
Conclusion
In conclusion, even though Bokeh Python and IronPDF aren't directly integrated, we can nevertheless accomplish comparable functionality by exporting Bokeh charts as pictures and then using IronPDF to embed them into PDF documents. While IronPDF gives Python programmatic capabilities for making PDF documents, Bokeh offers strong tools for creating dynamic and eye-catching charts.
You may easily add Bokeh charts to your PDF reports and documents by following the instructions listed above. This makes it possible to produce thorough, aesthetically pleasing texts with dynamic interactive data visualization that improves the way data-driven insights are presented and communicated.
By including IronPDF and Iron Software products in your development stack, you can make sure that your customers and end users receive feature-rich, high-end software solutions. Additionally, this will aid in process and project optimization.
With thorough documentation, an active community, and regular updates, IronPDF is a great tool to have on hand. IronPDF offers a free trial and various pricing options, so you can continue to get the best out of this product. Iron Software is a dependable partner for modern software development projects.