Plotly Python Tutorial for Data Science
A comprehensive solution for producing dynamic and eye-catching PDF reports or documents can be provided by integrating Plotly, a powerful Python package for building interactive and visually attractive graphs, with IronPDF. Plotly is great for creating interactive graphs and charts, while IronPDF can be used to work with PDF files in .NET applications.
Plotly and IronPDF can be combined to create PDF documents that easily include Plotly visualizations along with other content. This integration simplifies creating thorough reports, presentations, and other documents where data visualization is essential.

This article will cover how to use Plotly's powerful graphing features with IronPDF to create professional-quality PDF documents with dynamic and engaging visualizations. We'll go over methods for exporting Plotly graphs to static formats compatible with PDF documents, as well as how to use IronPDF to assemble these components into professional-looking and useful PDF reports.
We'll also discuss potential obstacles and recommended practices for achieving a smooth integration between Plotly and IronPDF, ensuring the final product meets the necessary standards for usability and quality.
What is Plotly Python?
A flexible and powerful package called Plotly is designed for use with Python to create engaging and interactive visualizations. Plotly's user-friendly interface and wide range of graphing features enable users to turn unstructured data into engaging stories, analyses, and presentations using graphs such as bar charts, line plots, scatter plots, pie charts, and any other types of charts.
Among its many features, it supports the creation of box plots, which are useful for displaying the distribution of data across different categories. A box plot provides a graphical summary of data variation, showing the median, quartiles, and potential outliers.
Additionally, Plotly facilitates the creation of bubble charts, which add a third dimension to data visualization by varying the size of the bubbles to represent another variable. This is particularly useful for highlighting correlations and trends within the data.
Plotly also includes functionality for adding error bars to various types of charts, helping to visualize the uncertainty or variability in the data. By incorporating error bars, users can provide a more comprehensive and accurate representation of their data's reliability and precision.
Interactive Visualizations
Plotly creates dynamic charts that are immediately manipulable and explorable in web browsers. Plotly dash elements can be toggled in and out of the line chart view, and users can pan and zoom in on data points to get more information.
Rich Graph Types
Many graph kinds, such as scatter plots, bar charts, line charts, pie charts, histograms, heatmaps, contour plots, 3D graphs, and more, are supported by Plotly.
Customization
Users have fine-grained control over how their plots look and behave. Annotations, color scales, legends, titles, axis labels, and other design choices are all customizable for Plotly graphs.
Export Options
Users of Plotly can export their graphs in several formats, such as PDF documents, interactive HTML files, and static images (PNG, JPEG, and SVG).
Integration
Plotly easily combines with various Python frameworks and modules, examples including Dash for creating web-based dash applications and dashboards, NumPy for numerical computation, and Pandas for data manipulation.
Create and Configure Plotly
Let's examine each step of the process of creating and setting up a Plotly plot.
Install Plotly
Plotly can be installed using pip if it hasn't already been done so.
pip install plotlypip install plotlyImport Plotly and Prepare Data
After importing the required modules from Plotly, get your data ready.
import plotly.graph_objects as go
# Sample data
x_data = [1, 2, 3, 4, 5]
y_data = [10, 11, 12, 13, 14]
import plotly.graph_objects as go
# Sample data
x_data = [1, 2, 3, 4, 5]
y_data = [10, 11, 12, 13, 14]Create Trace
Make a trace object that serves as a representation of the data and visualizes the desired visualization. We'll make a simple line plot here:
# Create a trace (line plot)
trace = go.Scatter(x=x_data, y=y_data)
# Create a trace (line plot)
trace = go.Scatter(x=x_data, y=y_data)Create Layout
By constructing a layout object, you can alter the plot's arrangement. This includes settings such as axis labels and titles:
# Create a layout
layout = go.Layout(
    title="My Plot",
    xaxis=dict(title="X-axis"),
    yaxis=dict(title="Y-axis")
)
# Create a layout
layout = go.Layout(
title="My Plot",
xaxis=dict(title="X-axis"),
yaxis=dict(title="Y-axis")
)Create Figure
Integrate the layout and trace to create a Figure object:
# Create a figure
fig = go.Figure(data=[trace], layout=layout)
# Create a figure
fig = go.Figure(data=[trace], layout=layout)Display Plot
Finally, to display the plot, use the show method:
# Display the plot
fig.show()
# Display the plot
fig.show()This tutorial completes the step-by-step installation process of making and setting up a Plotly plot. For even more sophisticated setups and capabilities, you can peruse Plotly's instructions in more detail.
Getting started
What is IronPDF?
IronPDF for Python is a powerful library for creating, editing, and converting PDF files. It allows programmers to work with pre-existing PDFs, convert HTML to PDFs, and perform other PDF-related actions through programming.
IronPDF is a helpful solution for applications that require dynamic PDF generation and processing, providing an adaptable and user-friendly way to generate high-quality PDF documents.
Features
Convert HTML to PDF
IronPDF can be used to transform HTML content into PDF documents. This makes it possible to create aesthetically pleasing PDF publications from web content using modern HTML5, CSS3, and JavaScript.
PDF Creation and Editing
New PDF documents generated programmatically can have text, pictures, tables, and other content added to them. You can open and edit pre-existing PDF documents with IronPDF. You can change or add to the PDF's content, as well as take out particular sections.
Advanced Styling and Layout
To style the content in PDFs, use CSS. Support for intricate layouts, fonts, colors, and other design components is part of this. Render HTML content that can be used with JavaScript so that dynamic content can be created in PDFs.
Install IronPDF
IronPDF can be installed with pip. Use the following command to install it:
pip install ironpdfpip install ironpdfGenerate a Plotly Report and Convert it into a PDF
In order to visualize data, combine a Python Plotly plot with IronPDF and produce a PDF document.
from ironpdf import *
import plotly.graph_objects as go

# Create a Plotly figure
fig = go.Figure(data=go.Scatter(x=[1, 2, 3], y=[3, 2, 1]))
# Export the Plotly figure to an HTML file
fig.write_html('demo.html')

# Create a PDF document instance using IronPDF
iron_pdf = ChromePdfRenderer()

# Render the HTML file as a PDF document
pdf = iron_pdf.RenderHtmlFileAsPdf("demo.html")

# Save the rendered PDF document
pdf.SaveAs("ironpdf_document_with_plotly.pdf")
print("PDF document generated successfully.")
from ironpdf import *
import plotly.graph_objects as go
# Create a Plotly figure
fig = go.Figure(data=go.Scatter(x=[1, 2, 3], y=[3, 2, 1]))
# Export the Plotly figure to an HTML file
fig.write_html('demo.html')
# Create a PDF document instance using IronPDF
iron_pdf = ChromePdfRenderer()
# Render the HTML file as a PDF document
pdf = iron_pdf.RenderHtmlFileAsPdf("demo.html")
# Save the rendered PDF document
pdf.SaveAs("ironpdf_document_with_plotly.pdf")
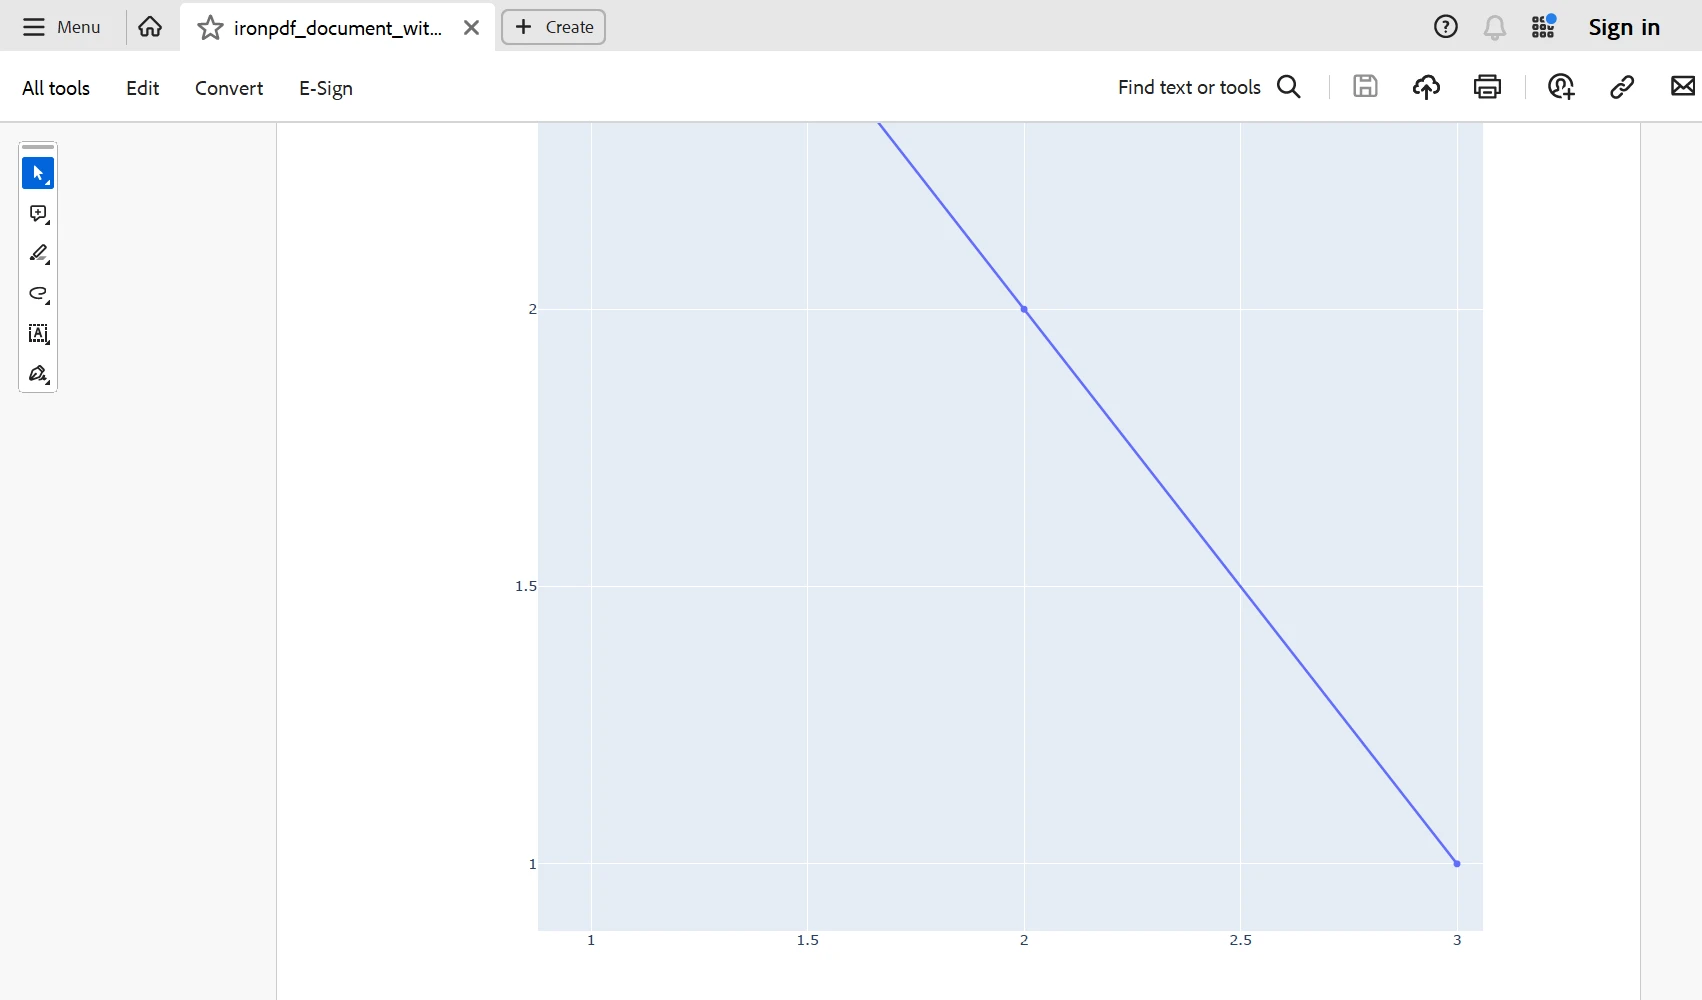
print("PDF document generated successfully.")To make a line plot, we utilize go.Scatter from Plotly. We can use go.Layout to alter the plot's layout. Lastly, we use go.Figure to assemble the plotted layout and trace into a figure.
We can export plots from Plotly as static files in HTML formats. In this case, the plot is exported as an HTML file called demo.html.
We created a PDF document by utilizing IronPDF's features. We then inserted the HTML material into the PDF using RenderHtmlFileAsPdf, and we saved the PDF file at the end using SaveAs.
You can make a Plotly plot in Python by following these instructions, exporting it as an image, and then integrating it with IronPDF to produce the output as a PDF document. Modify the code as necessary to suit your use case and environment.
Conclusion
In conclusion, the combination of Plotly and IronPDF for Python provides a robust option for producing dynamic, aesthetically pleasing PDF documents enhanced with interactive data visualizations. Plotly's flexible plotting features allow for the production of informative graphs and charts, and IronPDF makes it easier to create PDF documents that are suitable for a professional setting.
Users can easily integrate data-driven insights into their reports, presentations, and papers by combining Plotly's interactive plots with IronPDF's PDF-generating capabilities. Users can efficiently communicate data in a visually attractive manner by combining Plotly and IronPDF, whether they are displaying trends in numerical data, comparing information, or illustrating complex relationships.
You can ensure that your clients and end users receive feature-rich, high-end software solutions by integrating IronPDF and other Iron Software products into your development stack. This will also help to optimize your project and process. Modern software development projects can rely on IronPDF's pricing, which starts at $799, and Iron Software is a reliable partner because of its comprehensive documentation, vibrant community, and consistent enhancements.