d3 NPM(开发者如何使用)
数据可视化是现代网络开发的重要方面,有助于将复杂的数据集转化为可理解和可操作的洞察。 在众多可用的工具和库中,D3.js(数据驱动文档)因其强大且灵活的方法,在数据实践者中脱颖而出,成为创建动态交互图表的十年中坚力量。 在将D3.js与React结合时,您可以创建强大的、可维护的、和高效的数据可视化应用程序;React是一个流行的用于构建用户界面的JavaScript库。
本文将指导您如何将D3.js与React集成,并帮助您可视化数据。 另外,我们将探讨如何使用IronPDF PDF生成库从网站URL生成PDF。
D3.js是什么?
D3.js是一个JavaScript库,作为生成动态、交互式、数据驱动图形可视化在网页浏览器中的基础构件。 它使用HTML、SVG和CSS通过各种类型的图表和图形将数据变为现实。D3提供了一个强大的框架,用于将数据绑定到文档对象模型(DOM)并应用数据驱动的变换到文档上,并在许多高级图表库中用作基础。
React是什么?
React是由Facebook构建的开源JavaScript库。 它允许开发者创建可重用的UI组件,管理状态高效,并在数据变化时更新DOM。
设置您的环境
确保您的系统已安装Node.js和npm。 如果没有,您可以从官方Node.js网站下载并安装它们。
步骤1:创建一个新的React应用程序
首先,使用Create React App创建一个新的React应用程序,这是一个为新的React项目设置良好默认配置的工具。 您可以在终端中使用以下命令来完成此操作:
npx create-react-app d3-react-app
cd d3-react-app
npx create-react-app d3-react-app
cd d3-react-app步骤2:安装D3.js
接下来,通过以下命令安装D3.js npm包:
npm install d3npm install d3创建一个简单的条形图
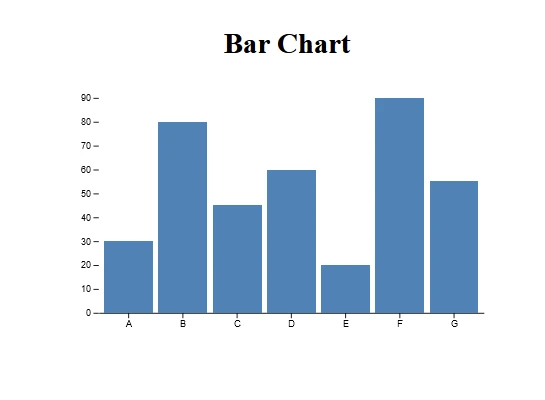
为了展示如何使用D3.js与React,我们将创建一个简单的条形图。
步骤1:设置组件
在BarChart.js的新组件,并使用以下代码为组件:
// src/BarChart.js
import React, { useRef, useEffect } from 'react';
import * as d3 from 'd3';

// BarChart component
const BarChart = ({ data }) => {
  const svgRef = useRef();

  useEffect(() => {
    const svg = d3.select(svgRef.current);
    const width = 500;
    const height = 300;
    const margin = { top: 20, right: 30, bottom: 40, left: 40 };

    // Set up the SVG dimensions
    svg.attr('width', width).attr('height', height);

    // Define the x scale
    const x = d3.scaleBand()
      .domain(data.map(d => d.name))
      .range([margin.left, width - margin.right])
      .padding(0.1);

    // Define the y scale
    const y = d3.scaleLinear()
      .domain([0, d3.max(data, d => d.value)])
      .nice()
      .range([height - margin.bottom, margin.top]);

    // Define the x-axis
    const xAxis = g => g
      .attr('transform', `translate(0,${height - margin.bottom})`)
      .call(d3.axisBottom(x).tickSizeOuter(0));

    // Define the y-axis
    const yAxis = g => g
      .attr('transform', `translate(${margin.left},0)`)
      .call(d3.axisLeft(y))
      .call(g => g.select('.domain').remove());

    svg.append('g').call(xAxis);
    svg.append('g').call(yAxis);

    // Create bars
    svg.append('g')
      .selectAll('rect')
      .data(data)
      .join('rect')
      .attr('x', d => x(d.name))
      .attr('y', d => y(d.value))
      .attr('height', d => y(0) - y(d.value))
      .attr('width', x.bandwidth())
      .attr('fill', 'steelblue');
  }, [data]);

  return <svg ref={svgRef}></svg>;
};

export default BarChart;
// src/BarChart.js
import React, { useRef, useEffect } from 'react';
import * as d3 from 'd3';
// BarChart component
const BarChart = ({ data }) => {
const svgRef = useRef();
useEffect(() => {
const svg = d3.select(svgRef.current);
const width = 500;
const height = 300;
const margin = { top: 20, right: 30, bottom: 40, left: 40 };
// Set up the SVG dimensions
svg.attr('width', width).attr('height', height);
// Define the x scale
const x = d3.scaleBand()
.domain(data.map(d => d.name))
.range([margin.left, width - margin.right])
.padding(0.1);
// Define the y scale
const y = d3.scaleLinear()
.domain([0, d3.max(data, d => d.value)])
.nice()
.range([height - margin.bottom, margin.top]);
// Define the x-axis
const xAxis = g => g
.attr('transform', `translate(0,${height - margin.bottom})`)
.call(d3.axisBottom(x).tickSizeOuter(0));
// Define the y-axis
const yAxis = g => g
.attr('transform', `translate(${margin.left},0)`)
.call(d3.axisLeft(y))
.call(g => g.select('.domain').remove());
svg.append('g').call(xAxis);
svg.append('g').call(yAxis);
// Create bars
svg.append('g')
.selectAll('rect')
.data(data)
.join('rect')
.attr('x', d => x(d.name))
.attr('y', d => y(d.value))
.attr('height', d => y(0) - y(d.value))
.attr('width', x.bandwidth())
.attr('fill', 'steelblue');
}, [data]);
return <svg ref={svgRef}></svg>;
};
export default BarChart;步骤2:使用组件
现在,在您的BarChart组件,并传递一些数据给它。
// src/App.js
import React from 'react';
import BarChart from './BarChart';

const App = () => {
  const data = [
    { name: 'A', value: 30 },
    { name: 'B', value: 80 },
    { name: 'C', value: 45 },
    { name: 'D', value: 60 },
    { name: 'E', value: 20 },
    { name: 'F', value: 90 },
    { name: 'G', value: 55 },
  ];

  return (
    <div className="App">
      <h1>Bar Chart</h1>
      <BarChart data={data} />
    </div>
  );
};

export default App;
// src/App.js
import React from 'react';
import BarChart from './BarChart';
const App = () => {
const data = [
{ name: 'A', value: 30 },
{ name: 'B', value: 80 },
{ name: 'C', value: 45 },
{ name: 'D', value: 60 },
{ name: 'E', value: 20 },
{ name: 'F', value: 90 },
{ name: 'G', value: 55 },
];
return (
<div className="App">
<h1>Bar Chart</h1>
<BarChart data={data} />
</div>
);
};
export default App;输出
IronPDF 简介
IronPDF是一个设计用于在Node.js应用程序中促进PDF生成的强大npm包。 它提供了无与伦比的创建PDF文档的灵活性,可以从HTML内容、URL或现有的PDF文件生成。 无论是生成发票、报告还是其他文件,IronPDF的直观API和广泛的功能集都可以简化这一过程。
IronPDF 的主要功能
HTML转PDF转换:轻松地将HTML内容转换为PDF文档,非常适合从网页内容生成动态PDF。
URL转PDF转换:直接从URL创建PDF,捕获网页内容并以编程方式将其保存为PDF文件。
PDF操作:轻松合并、拆分和操作现有的PDF文档。 IronPDF允许您附加页面、拆分文件等。
PDF安全性:通过密码加密或应用数字签名来保护您的PDF文档,防止未经授权的访问,从而保护您的敏感文档。
高质量输出:生成高质量的PDF文档,精准呈现文本、图像和格式,确保与原始内容的拟真度。
跨平台兼容性:IronPDF与多个平台兼容,包括Windows、Linux和macOS,适用于广泛的开发环境。
- 简单集成:通过npm包轻松将IronPDF集成到您的Node.js应用程序中。 详尽的API文档使将PDF生成功能纳入您的项目变得简单直接。
无论您是在构建web应用程序、服务器端脚本还是命令行工具,IronPDF都能有效和可靠地帮助您创建专业级的PDF文档。
IronPDF与D3 npm包:PDF生成变得轻而易举
安装依赖项:首先,使用以下命令创建一个新的 Next.js 项目(如果还没有):
npx create-next-app@latest d3charts-pdf --use-npm --example "https://github.com/vercel/next-learn/tree/main/basics/learn-starter"npx create-next-app@latest d3charts-pdf --use-npm --example "https://github.com/vercel/next-learn/tree/main/basics/learn-starter"接下来,导航到您的项目目录:
cd d3charts-pdfcd d3charts-pdf最后,安装所需的软件包:
yarn add @ironsoftware/ironpdf @ironsoftware/ironpdf-engine-windows-x64
yarn add d3
yarn add @ironsoftware/ironpdf @ironsoftware/ironpdf-engine-windows-x64
yarn add d3PDF 生成 API:第一步是创建后端 API 来生成 PDF 文档。 由于IronPDF仅在服务器端运行,用户需要在生成PDF时调用一个API。 在路径pages/api/pdf.js创建一个文件,并添加以下内容:
// pages/api/pdf.js
import { IronPdfGlobalConfig, PdfDocument } from "@ironsoftware/ironpdf";

// Apply your IronPDF license key
IronPdfGlobalConfig.getConfig().licenseKey = "Your license key";

export default async function handler(req, res) {
  try {
    const url = req.query.url;
    const pdf = await PdfDocument.fromUrl(url);
    const data = await pdf.saveAsBuffer();
    console.error('data PDF:', data);
    res.setHeader('Content-Type', 'application/pdf');
    res.setHeader('Content-Disposition', 'attachment; filename=awesomeIron.pdf');
    res.send(data);
  } catch (error) {
    console.error('Error generating PDF:', error);
    res.status(500).end();
  }
}
// pages/api/pdf.js
import { IronPdfGlobalConfig, PdfDocument } from "@ironsoftware/ironpdf";
// Apply your IronPDF license key
IronPdfGlobalConfig.getConfig().licenseKey = "Your license key";
export default async function handler(req, res) {
try {
const url = req.query.url;
const pdf = await PdfDocument.fromUrl(url);
const data = await pdf.saveAsBuffer();
console.error('data PDF:', data);
res.setHeader('Content-Type', 'application/pdf');
res.setHeader('Content-Disposition', 'attachment; filename=awesomeIron.pdf');
res.send(data);
} catch (error) {
console.error('Error generating PDF:', error);
res.status(500).end();
}
}IronPDF需要一个许可证密钥,您可以从试用许可证页面获取并将其放入以上代码中。
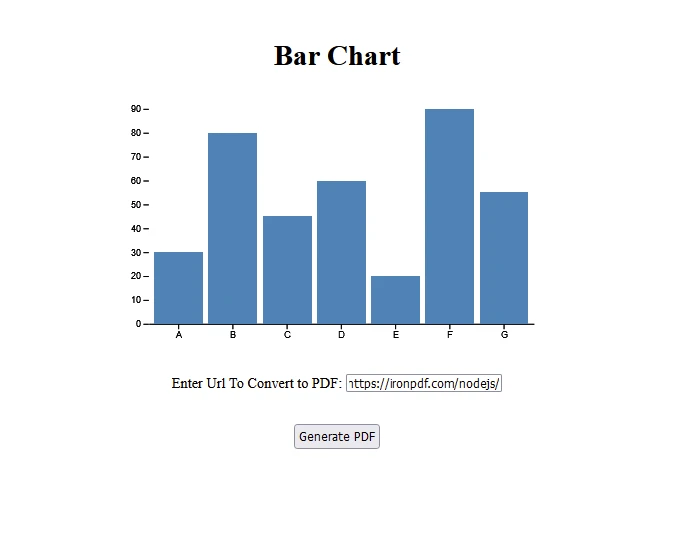
添加以下代码以接受用户的URL,然后在index.js文件中从给定的URL生成PDF。代码还展示了如何添加一个D3生成的图表和一个接收用户URL的后端API。
// index.js
"use client";
import React, { useState } from 'react';
import D3BarChart from './d3BarChart';
import styles from "../../styles/Home.module.css";

export default function D3Demo() {
  const [text, setText] = useState("");
  const data = [
    { name: 'A', value: 30 },
    { name: 'B', value: 80 },
    { name: 'C', value: 45 },
    { name: 'D', value: 60 },
    { name: 'E', value: 20 },
    { name: 'F', value: 90 },
    { name: 'G', value: 55 },
  ];

  const generatePdf = async () => {
    try {
      const response = await fetch("/api/pdf?url=" + text, {
        method: "GET",
      });
      const blob = await response.blob();
      const url = window.URL.createObjectURL(new Blob([blob]));
      const link = document.createElement("a");
      link.href = url;
      link.setAttribute("download", "awesomeIron.pdf");
      document.body.appendChild(link);
      link.click();
      link.parentNode.removeChild(link);
    } catch (error) {
      console.error("Error generating PDF:", error);
    }
  };

  const handleChange = (event) => {
    setText(event.target.value);
  };

  return (
    <div className={styles.container}>
      <h1>Bar Chart</h1>
      <D3BarChart data={data} />
      <p>
        <span>Enter URL To Convert to PDF:</span>{" "}
        <input type="text" value={text} onChange={handleChange} />
      </p>
      <button style={{ margin: 20, padding: 5 }} onClick={generatePdf}>
        Generate PDF
      </button>
    </div>
  );
}
// index.js
"use client";
import React, { useState } from 'react';
import D3BarChart from './d3BarChart';
import styles from "../../styles/Home.module.css";
export default function D3Demo() {
const [text, setText] = useState("");
const data = [
{ name: 'A', value: 30 },
{ name: 'B', value: 80 },
{ name: 'C', value: 45 },
{ name: 'D', value: 60 },
{ name: 'E', value: 20 },
{ name: 'F', value: 90 },
{ name: 'G', value: 55 },
];
const generatePdf = async () => {
try {
const response = await fetch("/api/pdf?url=" + text, {
method: "GET",
});
const blob = await response.blob();
const url = window.URL.createObjectURL(new Blob([blob]));
const link = document.createElement("a");
link.href = url;
link.setAttribute("download", "awesomeIron.pdf");
document.body.appendChild(link);
link.click();
link.parentNode.removeChild(link);
} catch (error) {
console.error("Error generating PDF:", error);
}
};
const handleChange = (event) => {
setText(event.target.value);
};
return (
<div className={styles.container}>
<h1>Bar Chart</h1>
<D3BarChart data={data} />
<p>
<span>Enter URL To Convert to PDF:</span>{" "}
<input type="text" value={text} onChange={handleChange} />
</p>
<button style={{ margin: 20, padding: 5 }} onClick={generatePdf}>
Generate PDF
</button>
</div>
);
}记得定义D3BarChart组件:
// d3BarChart.js
"use client";
import React, { useRef, useEffect } from 'react';
import * as d3 from 'd3';

// D3BarChart component
export default function D3BarChart({ data }) {
  const svgRef = useRef(); // ref svg element

  useEffect(() => {
    const svg = d3.select(svgRef.current);
    const width = 500;
    const height = 300;
    const margin = { top: 20, right: 30, bottom: 40, left: 40 };

    // Set up the SVG dimensions
    svg.attr('width', width).attr('height', height);

    // Define the x scale
    const x = d3.scaleBand()
      .domain(data.map(d => d.name))
      .range([margin.left, width - margin.right])
      .padding(0.1);

    // Define the y scale
    const y = d3.scaleLinear()
      .domain([0, d3.max(data, d => d.value)])
      .nice()
      .range([height - margin.bottom, margin.top]);

    // Define the x-axis
    const xAxis = g => g
      .attr('transform', `translate(0,${height - margin.bottom})`)
      .call(d3.axisBottom(x).tickSizeOuter(0));

    // Define the y-axis
    const yAxis = g => g
      .attr('transform', `translate(${margin.left},0)`)
      .call(d3.axisLeft(y))
      .call(g => g.select('.domain').remove());

    svg.append('g').call(xAxis);
    svg.append('g').call(yAxis);

    // Create bars
    svg.append('g')
      .selectAll('rect')
      .data(data)
      .join('rect')
      .attr('x', d => x(d.name))
      .attr('y', d => y(d.value))
      .attr('height', d => y(0) - y(d.value))
      .attr('width', x.bandwidth())
      .attr('fill', 'steelblue');
  }, [data]);

  return <svg ref={svgRef}></svg>;
}
// d3BarChart.js
"use client";
import React, { useRef, useEffect } from 'react';
import * as d3 from 'd3';
// D3BarChart component
export default function D3BarChart({ data }) {
const svgRef = useRef(); // ref svg element
useEffect(() => {
const svg = d3.select(svgRef.current);
const width = 500;
const height = 300;
const margin = { top: 20, right: 30, bottom: 40, left: 40 };
// Set up the SVG dimensions
svg.attr('width', width).attr('height', height);
// Define the x scale
const x = d3.scaleBand()
.domain(data.map(d => d.name))
.range([margin.left, width - margin.right])
.padding(0.1);
// Define the y scale
const y = d3.scaleLinear()
.domain([0, d3.max(data, d => d.value)])
.nice()
.range([height - margin.bottom, margin.top]);
// Define the x-axis
const xAxis = g => g
.attr('transform', `translate(0,${height - margin.bottom})`)
.call(d3.axisBottom(x).tickSizeOuter(0));
// Define the y-axis
const yAxis = g => g
.attr('transform', `translate(${margin.left},0)`)
.call(d3.axisLeft(y))
.call(g => g.select('.domain').remove());
svg.append('g').call(xAxis);
svg.append('g').call(yAxis);
// Create bars
svg.append('g')
.selectAll('rect')
.data(data)
.join('rect')
.attr('x', d => x(d.name))
.attr('y', d => y(d.value))
.attr('height', d => y(0) - y(d.value))
.attr('width', x.bandwidth())
.attr('fill', 'steelblue');
}, [data]);
return <svg ref={svgRef}></svg>;
}代码解释:
- 我们创建了一个Next.js应用并添加了必要的软件包,IronPDF和D3。
- 然后我们使用D3创建了BarChart组件。
- 添加一个输入和按钮以生成PDF文档。
输出
API:
IronPDF 许可证
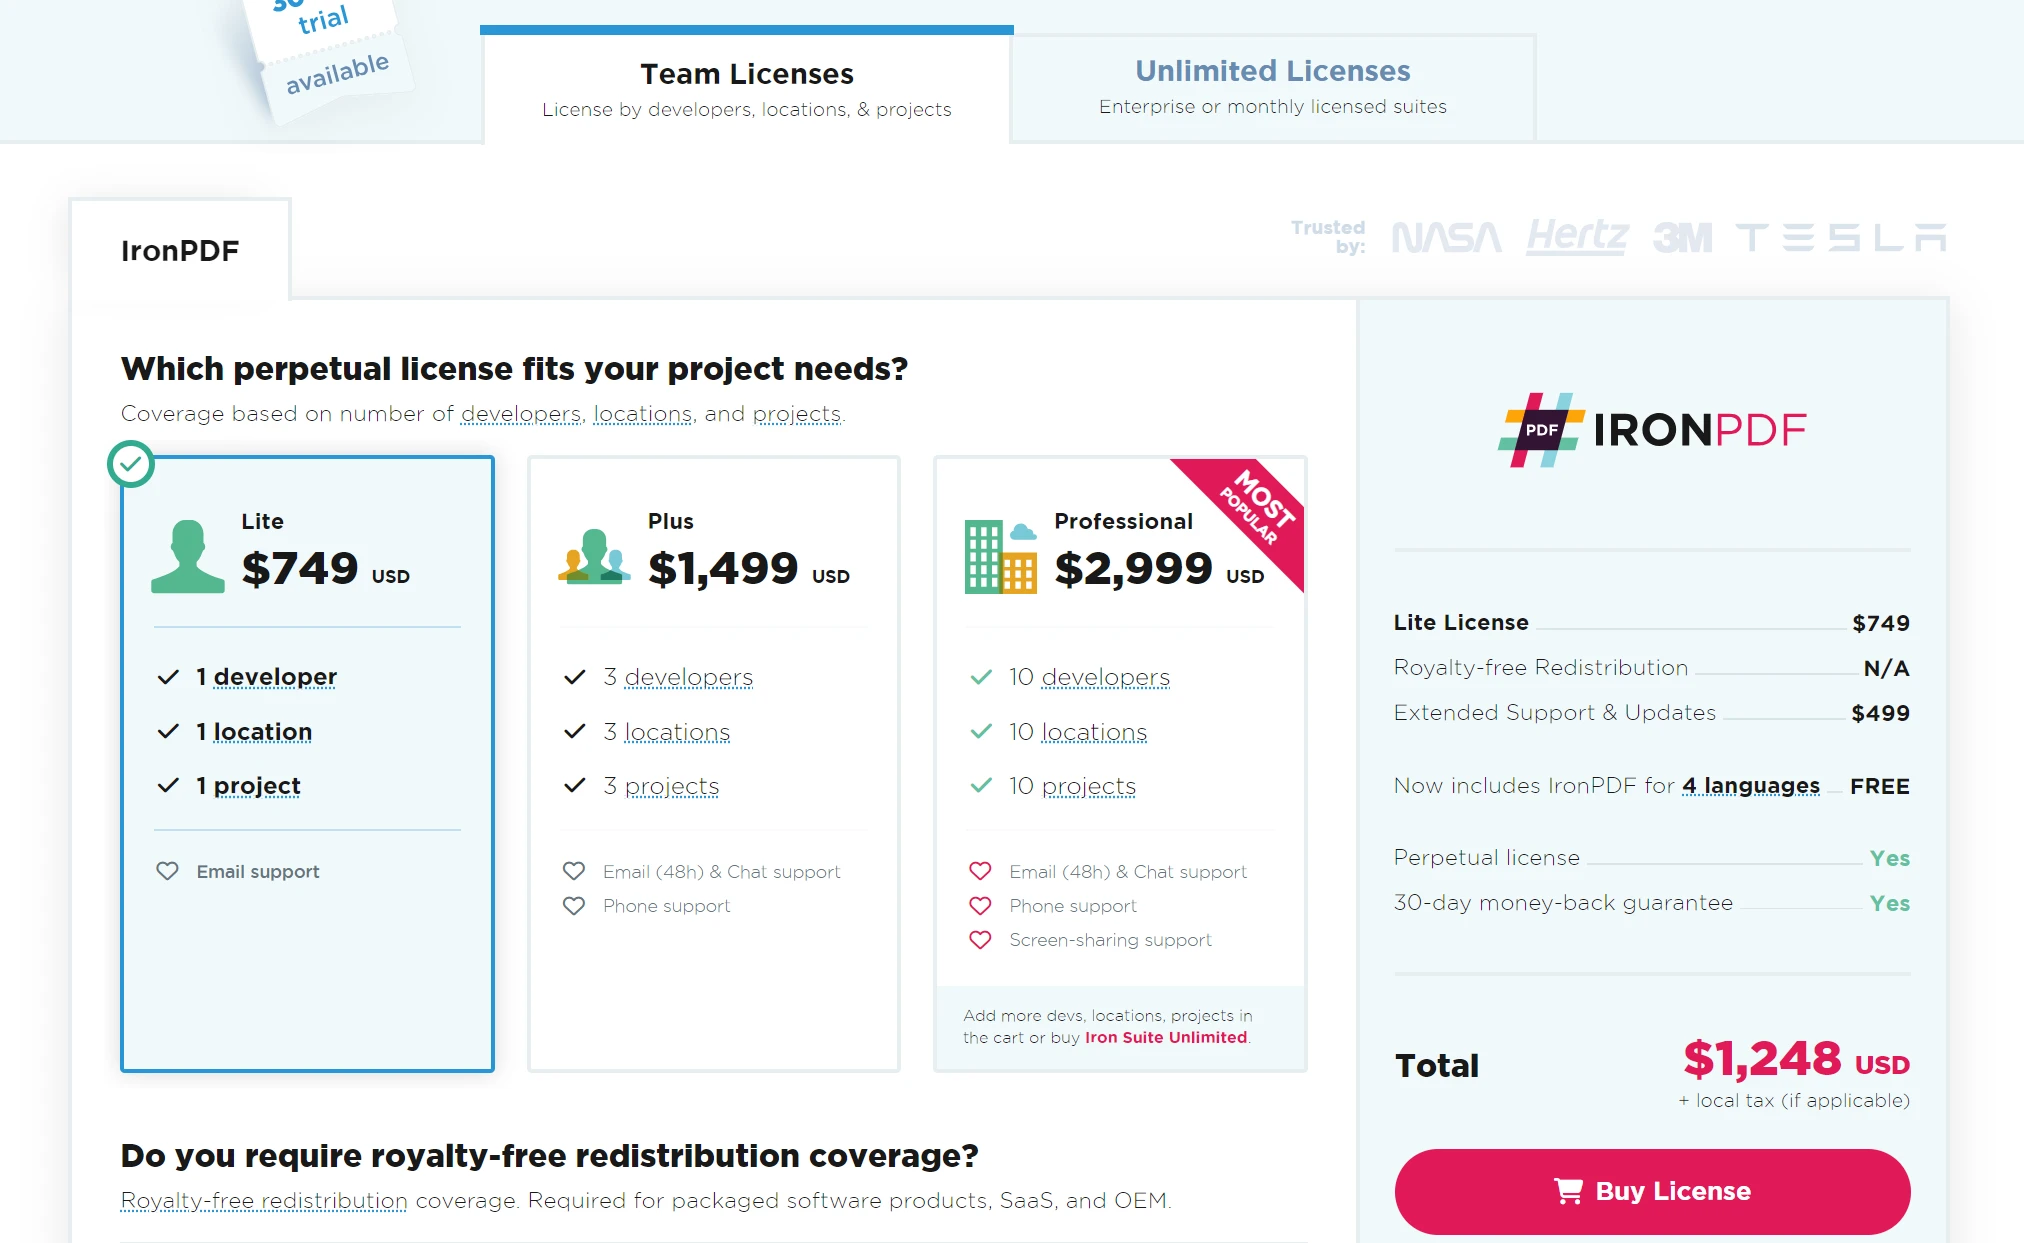
IronPDF试用许可证允许用户在购买之前测试其丰富的功能。 有关永续许可的详细信息,请参见IronPDF许可页面。
在此处放置许可证密钥:
import { IronPdfGlobalConfig, PdfDocument } from "@ironsoftware/ironpdf";
// Apply your IronPDF license key
IronPdfGlobalConfig.getConfig().licenseKey = "Add Your key here";
import { IronPdfGlobalConfig, PdfDocument } from "@ironsoftware/ironpdf";
// Apply your IronPDF license key
IronPdfGlobalConfig.getConfig().licenseKey = "Add Your key here";结论
通过将D3.js和React结合,您可以利用这两个库的优点,创建强大和交互性的数据可视化。 React提供了一个用于构建用户界面的强大框架,而D3.js则提供了广泛的数据操作和可视化能力。 使用NPM管理依赖项确保了您的项目可维护和可扩展。 此简单的条形图示例只是个开始; 使用这些工具,您可以根据您的具体需求创建各种复杂和交互性的数据可视化。