
d3 NPM(開發者的使用方法)

資料視覺化是現代網頁開發的重要方面,有助於將複雜的資料集轉換為可理解且可執行的深入見解。 在各種可用的工具和程式庫中,D3.js(Data-Driven Documents)因其強大且靈活的方法,在資料從業者中已經站立超過十年,在建立動態和互動圖表方面脫穎而出。 當將D3.js與React這個流行的JavaScript程式庫結合使用來構建使用者介面時,您可以構建強大、易於維護且高效的資料視覺化應用程式。
本文將指導您如何整合D3.js與React,以及如何幫助可視化資料。 我們也會研究IronPDF PDF 生成程式庫以從網站的URL生成PDF。
什麼是D3.js?
D3.js是一個JavaScript程式庫,作為生產動態、互動的資料驅動圖形可視化的基礎構建模塊,運行於網頁瀏覽器中。 它使用HTML、SVG和CSS通過各種型別的圖表和圖形將資料呈現出來。D3提供了一個強大的框架,用於將資料綁定到文件物件模型(DOM)並將資料驅動的變換應用於文件,並且它被用作許多高階圖表程式庫中的基礎。
什麼是React?
React是一個由Facebook構建的開源JavaScript程式庫。 它允許開發人員建立可重用的UI組件,有效地管理狀態,並根據資料的變化來更新DOM。
設置您的環境
確保您的系統已安裝Node.js和npm。 如果沒有,可以從官方Node.js網站下載並安裝。
步驟1:建立一個新的React應用程式
首先,使用Create React App建立一個新的React應用程式,這個工具可以使用良好的預設配置設置一個新的React專案。 您可以在您的終端中使用以下命令來完成此操作:
npx create-react-app d3-react-app
cd d3-react-app
npx create-react-app d3-react-app
cd d3-react-app步驟2:安裝D3.js
接下來,通過以下命令安裝D3.js的npm包:
npm install d3npm install d3建立一個簡單的柱狀圖
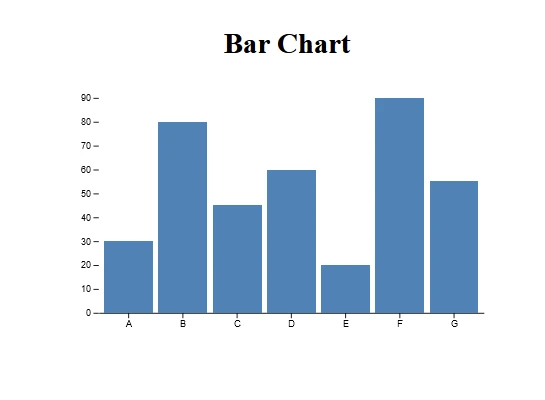
為了演示如何將D3.js與React一起使用,我們將建立一個簡單的柱狀圖。
步驟1:設置組件
在BarChart.js的新組件,並使用以下程式碼來建立該組件:
// src/BarChart.js
import React, { useRef, useEffect } from 'react';
import * as d3 from 'd3';

// BarChart component
const BarChart = ({ data }) => {
  const svgRef = useRef();

  useEffect(() => {
    const svg = d3.select(svgRef.current);
    const width = 500;
    const height = 300;
    const margin = { top: 20, right: 30, bottom: 40, left: 40 };

    // Set up the SVG dimensions
    svg.attr('width', width).attr('height', height);

    // Define the x scale
    const x = d3.scaleBand()
      .domain(data.map(d => d.name))
      .range([margin.left, width - margin.right])
      .padding(0.1);

    // Define the y scale
    const y = d3.scaleLinear()
      .domain([0, d3.max(data, d => d.value)])
      .nice()
      .range([height - margin.bottom, margin.top]);

    // Define the x-axis
    const xAxis = g => g
      .attr('transform', `translate(0,${height - margin.bottom})`)
      .call(d3.axisBottom(x).tickSizeOuter(0));

    // Define the y-axis
    const yAxis = g => g
      .attr('transform', `translate(${margin.left},0)`)
      .call(d3.axisLeft(y))
      .call(g => g.select('.domain').remove());

    svg.append('g').call(xAxis);
    svg.append('g').call(yAxis);

    // Create bars
    svg.append('g')
      .selectAll('rect')
      .data(data)
      .join('rect')
      .attr('x', d => x(d.name))
      .attr('y', d => y(d.value))
      .attr('height', d => y(0) - y(d.value))
      .attr('width', x.bandwidth())
      .attr('fill', 'steelblue');
  }, [data]);

  return <svg ref={svgRef}></svg>;
};

export default BarChart;
// src/BarChart.js
import React, { useRef, useEffect } from 'react';
import * as d3 from 'd3';
// BarChart component
const BarChart = ({ data }) => {
const svgRef = useRef();
useEffect(() => {
const svg = d3.select(svgRef.current);
const width = 500;
const height = 300;
const margin = { top: 20, right: 30, bottom: 40, left: 40 };
// Set up the SVG dimensions
svg.attr('width', width).attr('height', height);
// Define the x scale
const x = d3.scaleBand()
.domain(data.map(d => d.name))
.range([margin.left, width - margin.right])
.padding(0.1);
// Define the y scale
const y = d3.scaleLinear()
.domain([0, d3.max(data, d => d.value)])
.nice()
.range([height - margin.bottom, margin.top]);
// Define the x-axis
const xAxis = g => g
.attr('transform', `translate(0,${height - margin.bottom})`)
.call(d3.axisBottom(x).tickSizeOuter(0));
// Define the y-axis
const yAxis = g => g
.attr('transform', `translate(${margin.left},0)`)
.call(d3.axisLeft(y))
.call(g => g.select('.domain').remove());
svg.append('g').call(xAxis);
svg.append('g').call(yAxis);
// Create bars
svg.append('g')
.selectAll('rect')
.data(data)
.join('rect')
.attr('x', d => x(d.name))
.attr('y', d => y(d.value))
.attr('height', d => y(0) - y(d.value))
.attr('width', x.bandwidth())
.attr('fill', 'steelblue');
}, [data]);
return <svg ref={svgRef}></svg>;
};
export default BarChart;步驟2:使用組件
現在,在您的BarChart組件,並傳遞一些資料給它。
// src/App.js
import React from 'react';
import BarChart from './BarChart';

const App = () => {
  const data = [
    { name: 'A', value: 30 },
    { name: 'B', value: 80 },
    { name: 'C', value: 45 },
    { name: 'D', value: 60 },
    { name: 'E', value: 20 },
    { name: 'F', value: 90 },
    { name: 'G', value: 55 },
  ];

  return (
    <div className="App">
      <h1>Bar Chart</h1>
      <BarChart data={data} />
    </div>
  );
};

export default App;
// src/App.js
import React from 'react';
import BarChart from './BarChart';
const App = () => {
const data = [
{ name: 'A', value: 30 },
{ name: 'B', value: 80 },
{ name: 'C', value: 45 },
{ name: 'D', value: 60 },
{ name: 'E', value: 20 },
{ name: 'F', value: 90 },
{ name: 'G', value: 55 },
];
return (
<div className="App">
<h1>Bar Chart</h1>
<BarChart data={data} />
</div>
);
};
export default App;輸出
介紹IronPDF
IronPDF是一個為在Node.js應用程式中促成PDF生成而設計的強大npm包。 它允許以無與倫比的靈活性從HTML內容、URL或現有的PDF文件生成PDF文件。 無論是生成發票、報告,還是其他文件,IronPDF憑借其直觀的API和豐富的特性集簡化了這一過程。
IronPDF的主要特性
HTML到PDF轉換:輕鬆將HTML內容轉換為PDF文件,非常適合從網頁內容生成動態PDF。
URL到PDF轉換:直接從URLs建立PDF,捕獲網頁內容並以程式方式將其保存為PDF文件。
PDF操作:輕鬆合併、拆分和操作現有的PDF文件。 IronPDF允許您附加頁面、拆分文件等。
PDF安全:通過設置密碼加密或應用數位簽章來保護您的PDF文件,以防止未經授權的存取,保護您的敏感文件。
高品質輸出:產生高品質的PDF文件,精確呈現文字、圖片和格式,確保與原始內容的忠實一致。
跨平台相容性:IronPDF與多個平台相容,包括Windows、Linux和macOS,適合各種開發環境。
- 簡單整合:輕鬆將IronPDF整合到您的Node.js應用程式中,使用其npm包。 詳細說明的API使得將PDF生成的功能無縫整合到您的專案中。
無論您是在構建一個網頁應用程式、伺服器端腳本,還是一個命令列工具,IronPDF都能讓您高效且可靠地建立專業級的PDF文件。
IronPDF和D3 npm包:讓PDF生成變得簡單
安裝相依項:首先,建立一個新的Next.js專案(如果您還沒有),使用以下命令:
npx create-next-app@latest d3charts-pdf --use-npm --example "https://github.com/vercel/next-learn/tree/main/basics/learn-starter"npx create-next-app@latest d3charts-pdf --use-npm --example "https://github.com/vercel/next-learn/tree/main/basics/learn-starter"接下來,導航至您的專案目錄:
cd d3charts-pdfcd d3charts-pdf最後,安裝所需的包:
yarn add @ironsoftware/ironpdf @ironsoftware/ironpdf-engine-windows-x64
yarn add d3
yarn add @ironsoftware/ironpdf @ironsoftware/ironpdf-engine-windows-x64
yarn add d3PDF生成API:第一步是建立一個後端API來生成PDF文件。 由於IronPDF僅在伺服器端執行,當使用者想要生成PDF時,我們需要建立一個API來調用。 在路徑pages/api/pdf.js中建立一個文件,並新增下面的內容:
// pages/api/pdf.js
import { IronPdfGlobalConfig, PdfDocument } from "@ironsoftware/ironpdf";

// Apply your IronPDF license key
IronPdfGlobalConfig.getConfig().licenseKey = "Your license key";

export default async function handler(req, res) {
  try {
    const url = req.query.url;
    const pdf = await PdfDocument.fromUrl(url);
    const data = await pdf.saveAsBuffer();
    console.error('data PDF:', data);
    res.setHeader('Content-Type', 'application/pdf');
    res.setHeader('Content-Disposition', 'attachment; filename=awesomeIron.pdf');
    res.send(data);
  } catch (error) {
    console.error('Error generating PDF:', error);
    res.status(500).end();
  }
}
// pages/api/pdf.js
import { IronPdfGlobalConfig, PdfDocument } from "@ironsoftware/ironpdf";
// Apply your IronPDF license key
IronPdfGlobalConfig.getConfig().licenseKey = "Your license key";
export default async function handler(req, res) {
try {
const url = req.query.url;
const pdf = await PdfDocument.fromUrl(url);
const data = await pdf.saveAsBuffer();
console.error('data PDF:', data);
res.setHeader('Content-Type', 'application/pdf');
res.setHeader('Content-Disposition', 'attachment; filename=awesomeIron.pdf');
res.send(data);
} catch (error) {
console.error('Error generating PDF:', error);
res.status(500).end();
}
}IronPDF需要一個授權金鑰,您可以從試用授權頁面獲取並將其放在上述程式碼中。
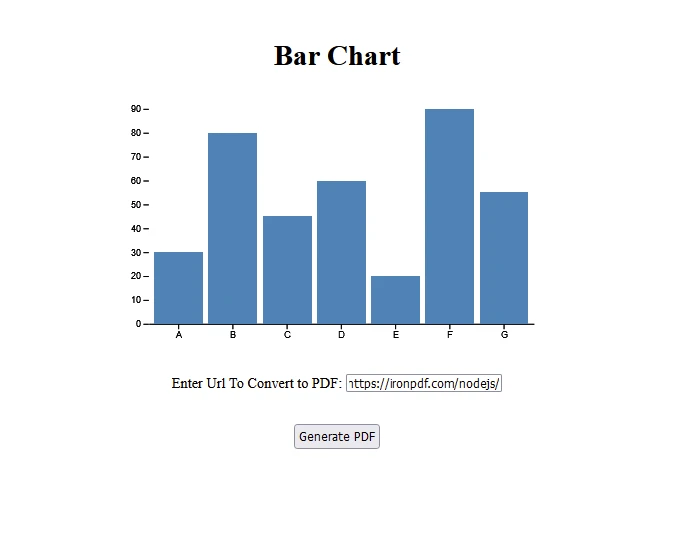
新增以下程式碼以接受使用者的URL,然後在index.js文件中從給定URL生成PDF。該程式碼還顯示了如何新增一個D3生成的圖表和一個後端API來接收使用者的URL。
// index.js
"use client";
import React, { useState } from 'react';
import D3BarChart from './d3BarChart';
import styles from "../../styles/Home.module.css";

export default function D3Demo() {
  const [text, setText] = useState("");
  const data = [
    { name: 'A', value: 30 },
    { name: 'B', value: 80 },
    { name: 'C', value: 45 },
    { name: 'D', value: 60 },
    { name: 'E', value: 20 },
    { name: 'F', value: 90 },
    { name: 'G', value: 55 },
  ];

  const generatePdf = async () => {
    try {
      const response = await fetch("/api/pdf?url=" + text, {
        method: "GET",
      });
      const blob = await response.blob();
      const url = window.URL.createObjectURL(new Blob([blob]));
      const link = document.createElement("a");
      link.href = url;
      link.setAttribute("download", "awesomeIron.pdf");
      document.body.appendChild(link);
      link.click();
      link.parentNode.removeChild(link);
    } catch (error) {
      console.error("Error generating PDF:", error);
    }
  };

  const handleChange = (event) => {
    setText(event.target.value);
  };

  return (
    <div className={styles.container}>
      <h1>Bar Chart</h1>
      <D3BarChart data={data} />
      <p>
        <span>Enter URL To Convert to PDF:</span>{" "}
        <input type="text" value={text} onChange={handleChange} />
      </p>
      <button style={{margin: 20, padding: 5}} onClick={generatePdf}>
        Generate PDF
      </button>
    </div>
  );
}
// index.js
"use client";
import React, { useState } from 'react';
import D3BarChart from './d3BarChart';
import styles from "../../styles/Home.module.css";
export default function D3Demo() {
const [text, setText] = useState("");
const data = [
{ name: 'A', value: 30 },
{ name: 'B', value: 80 },
{ name: 'C', value: 45 },
{ name: 'D', value: 60 },
{ name: 'E', value: 20 },
{ name: 'F', value: 90 },
{ name: 'G', value: 55 },
];
const generatePdf = async () => {
try {
const response = await fetch("/api/pdf?url=" + text, {
method: "GET",
});
const blob = await response.blob();
const url = window.URL.createObjectURL(new Blob([blob]));
const link = document.createElement("a");
link.href = url;
link.setAttribute("download", "awesomeIron.pdf");
document.body.appendChild(link);
link.click();
link.parentNode.removeChild(link);
} catch (error) {
console.error("Error generating PDF:", error);
}
};
const handleChange = (event) => {
setText(event.target.value);
};
return (
<div className={styles.container}>
<h1>Bar Chart</h1>
<D3BarChart data={data} />
<p>
<span>Enter URL To Convert to PDF:</span>{" "}
<input type="text" value={text} onChange={handleChange} />
</p>
<button style={{margin: 20, padding: 5}} onClick={generatePdf}>
Generate PDF
</button>
</div>
);
}請記得定義D3BarChart組件:
// d3BarChart.js
"use client";
import React, { useRef, useEffect } from 'react';
import * as d3 from 'd3';

// D3BarChart component
export default function D3BarChart({ data }) {
  const svgRef = useRef(); // ref svg element

  useEffect(() => {
    const svg = d3.select(svgRef.current);
    const width = 500;
    const height = 300;
    const margin = { top: 20, right: 30, bottom: 40, left: 40 };

    // Set up the SVG dimensions
    svg.attr('width', width).attr('height', height);

    // Define the x scale
    const x = d3.scaleBand()
      .domain(data.map(d => d.name))
      .range([margin.left, width - margin.right])
      .padding(0.1);

    // Define the y scale
    const y = d3.scaleLinear()
      .domain([0, d3.max(data, d => d.value)])
      .nice()
      .range([height - margin.bottom, margin.top]);

    // Define the x-axis
    const xAxis = g => g
      .attr('transform', `translate(0,${height - margin.bottom})`)
      .call(d3.axisBottom(x).tickSizeOuter(0));

    // Define the y-axis
    const yAxis = g => g
      .attr('transform', `translate(${margin.left},0)`)
      .call(d3.axisLeft(y))
      .call(g => g.select('.domain').remove());

    svg.append('g').call(xAxis);
    svg.append('g').call(yAxis);

    // Create bars
    svg.append('g')
      .selectAll('rect')
      .data(data)
      .join('rect')
      .attr('x', d => x(d.name))
      .attr('y', d => y(d.value))
      .attr('height', d => y(0) - y(d.value))
      .attr('width', x.bandwidth())
      .attr('fill', 'steelblue');
  }, [data]);

  return <svg ref={svgRef}></svg>;
}
// d3BarChart.js
"use client";
import React, { useRef, useEffect } from 'react';
import * as d3 from 'd3';
// D3BarChart component
export default function D3BarChart({ data }) {
const svgRef = useRef(); // ref svg element
useEffect(() => {
const svg = d3.select(svgRef.current);
const width = 500;
const height = 300;
const margin = { top: 20, right: 30, bottom: 40, left: 40 };
// Set up the SVG dimensions
svg.attr('width', width).attr('height', height);
// Define the x scale
const x = d3.scaleBand()
.domain(data.map(d => d.name))
.range([margin.left, width - margin.right])
.padding(0.1);
// Define the y scale
const y = d3.scaleLinear()
.domain([0, d3.max(data, d => d.value)])
.nice()
.range([height - margin.bottom, margin.top]);
// Define the x-axis
const xAxis = g => g
.attr('transform', `translate(0,${height - margin.bottom})`)
.call(d3.axisBottom(x).tickSizeOuter(0));
// Define the y-axis
const yAxis = g => g
.attr('transform', `translate(${margin.left},0)`)
.call(d3.axisLeft(y))
.call(g => g.select('.domain').remove());
svg.append('g').call(xAxis);
svg.append('g').call(yAxis);
// Create bars
svg.append('g')
.selectAll('rect')
.data(data)
.join('rect')
.attr('x', d => x(d.name))
.attr('y', d => y(d.value))
.attr('height', d => y(0) - y(d.value))
.attr('width', x.bandwidth())
.attr('fill', 'steelblue');
}, [data]);
return <svg ref={svgRef}></svg>;
}程式碼解釋:
- 我們建立了一個Next.js應用並新增必要的包,IronPDF和D3。
- 然後,我們使用D3建立BarChart組件。
- 新增一個輸入和按鈕來生成PDF文件。
輸出
API:
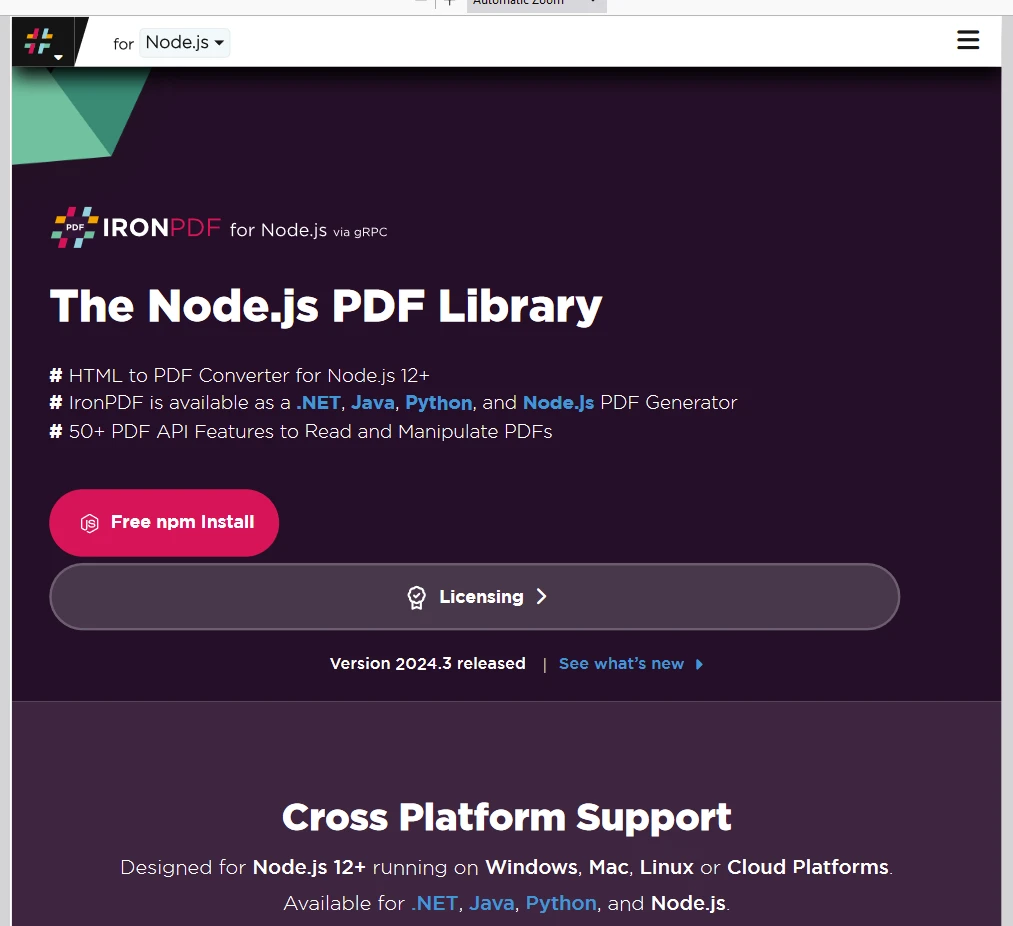
從此[IronPDF URL](/nodejs/)生成的PDF:
IronPDF 授權
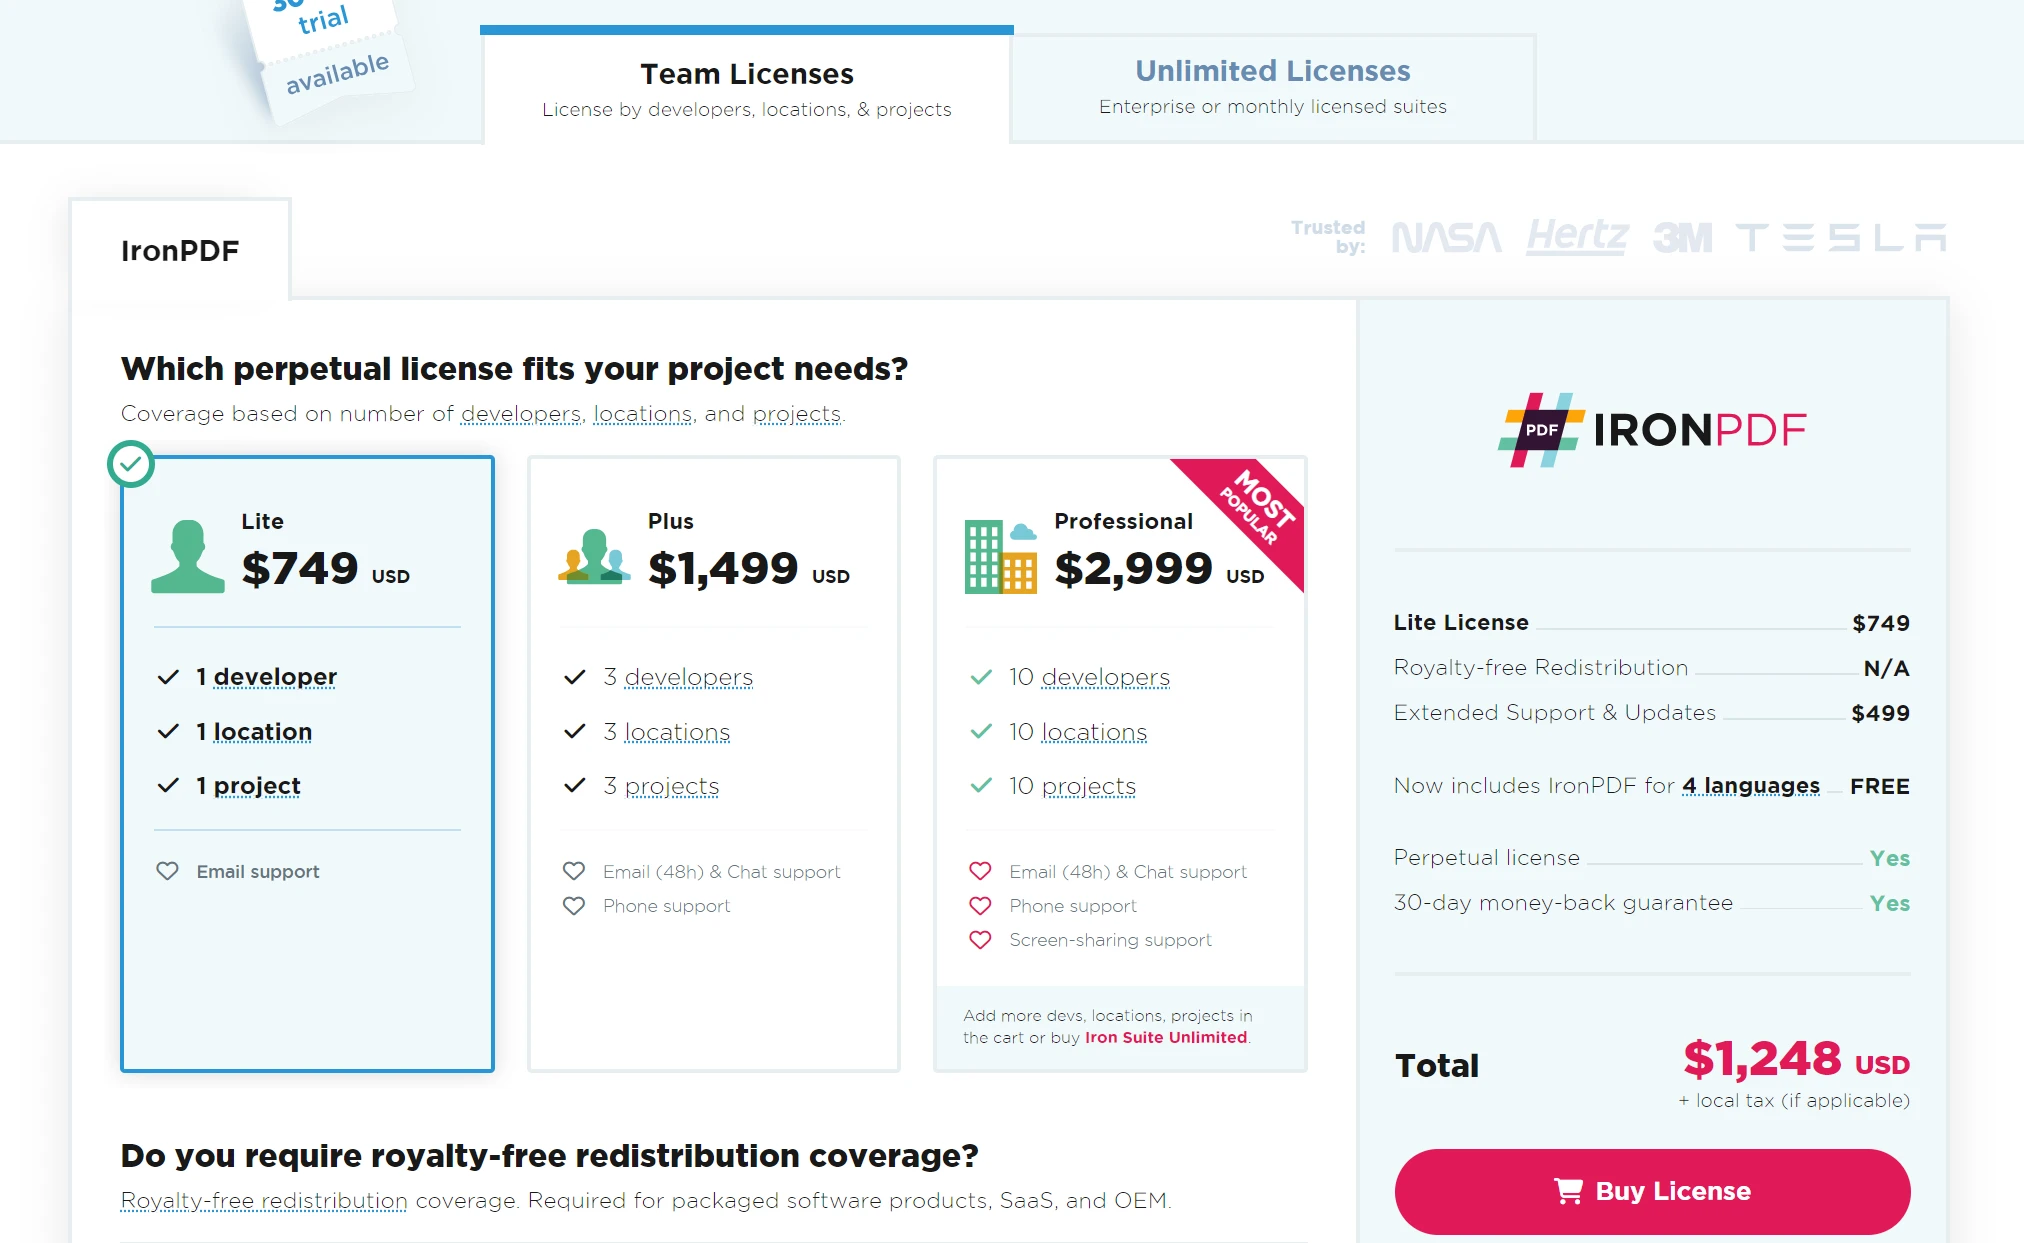
IronPDF試用授權允許使用者在購買之前查看其廣泛的功能。 更多關於永久授權的詳情可以在IronPDF 授權頁面找到。
請在此處放置授權金鑰:
import { IronPdfGlobalConfig, PdfDocument } from "@ironsoftware/ironpdf";
// Apply your IronPDF license key
IronPdfGlobalConfig.getConfig().licenseKey = "Add Your key here";
import { IronPdfGlobalConfig, PdfDocument } from "@ironsoftware/ironpdf";
// Apply your IronPDF license key
IronPdfGlobalConfig.getConfig().licenseKey = "Add Your key here";結論
通過將D3.js與React結合,您可以利用這兩個程式庫的優勢來建立強大且具有交互性的資料視覺化。 React提供了一個強大的框架來建立使用者介面,而D3.js則提供了豐富的資料操作和可視化能力。 使用NPM來管理相依項,確保您的專案具有可維護性和可擴展性。 這個簡單柱狀圖的範例僅僅是開始; 使用這些工具,您可以建立多種精細和互動的資料視覺化,滿足您的特定需求。






 免費開始
免費開始 免費開始
免費開始 預訂免費直播演示