igraph python(开发人员如何使用)
图形和复杂网络研究是计算机科学和数学的基本概念,用于建模复杂的联系和交互。 图的节点,有时也称为顶点,和边,有时称为链接,实质上只是实体及其关系的可视化表示和解释,通过连接节点的边显示。
更普遍地,所有用于运输系统、社交网络和通信网络的图都被视为网络。 通过观察图和网络,我们可以理解并克服与连接性、流动性和网络结构相关的问题。 这种工作提供了从社会动态和组织结构到高效路由和优化算法的各种领域的洞察。 这些概念在网络理论、运筹学和数据科学中非常重要。
在本文中,我们将使用 igraph 展示如何生成网络图并将其打印到 PDF 文件中使用灵活且可靠的 IronPDF 库。
什么是 igraph?
Igraph 是一个强大的 Python 包,用于生成、操作和分析复杂的图形和网络。 它提供了大量工具包来处理图形,从生成到操作及其可视化。 Python igraph 通过多种算法计算各种中心性、最短路径、社区结构等指标,方便实现网络分析。
因此,这个库提供了良好的可视化效果,具有针对有向和无向图形的自适应布局和属性。Igraph 非常灵活和快速,常用于分析困难的关系数据,如数据科学、计算生物学和社交网络研究。
设置和使用 igraph Python 包
要开始在 Python 中进行基本的图理论操作和配置,请使用以下步骤为自己创建、配置和使用 igraph。
安装 igraph 包
您必须首先安装 igraph 包。可以使用以下 pip 命令进行安装:
pip install igraphpip install igraph使用 Igraph 创建图形
这是一个简单的示例,展示如何使用 igraph 构建和设置图形:
from igraph import Graph, plot
# Create an empty graph
g = Graph()
# Add vertices (nodes)
g.add_vertices(5) # Adding 5 vertices
# Add edges (connections between vertices)
g.add_edges([(0, 1), (1, 2), (2, 3), (3, 4), (4, 0), (0, 2)]) # Adding edges
# Add vertex ids and edge attributes
g.vs["name"] = ["A", "B", "C", "D", "E"] # Vertex labels
g.es["weight"] = [1, 2, 3, 4, 5, 6] # Edge weights
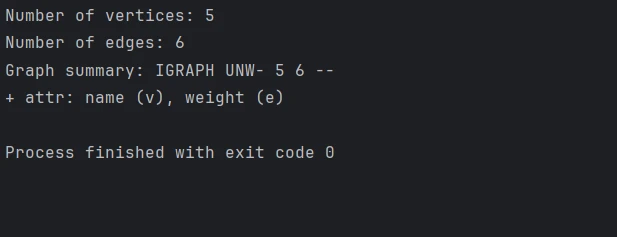
# Print basic graph structural properties
print("Number of vertices:", g.vcount())
print("Number of edges:", g.ecount())
print("Graph summary:", g.summary())from igraph import Graph, plot
# Create an empty graph
g = Graph()
# Add vertices (nodes)
g.add_vertices(5) # Adding 5 vertices
# Add edges (connections between vertices)
g.add_edges([(0, 1), (1, 2), (2, 3), (3, 4), (4, 0), (0, 2)]) # Adding edges
# Add vertex ids and edge attributes
g.vs["name"] = ["A", "B", "C", "D", "E"] # Vertex labels
g.es["weight"] = [1, 2, 3, 4, 5, 6] # Edge weights
# Print basic graph structural properties
print("Number of vertices:", g.vcount())
print("Number of edges:", g.ecount())
print("Graph summary:", g.summary())控制台输出
配置图形布局和可视化
我们可以使用 igraph 的一些内置功能绘制图形。 使用以下内容更改外观和布局:
# Define a layout for the graph
layout = g.layout("circle")  # Layout in a circular arrangement

# Plot the graph with labels and custom options
plot(
    g,
    layout=layout,
    vertex_label=g.vs["name"],  # Label vertices
    vertex_color="lightblue",   # Vertex color
    edge_width=g.es["weight"],  # Edge width based on weight
    vertex_size=30,             # Vertex size
    edge_color="grey",          # Edge color
    bbox=(300, 300),            # Size of the plot
    margin=20                   # Margin around the plot
)

# Save the plotted graph to a file
plot(g, layout=layout, bbox=(300, 300), margin=20).save('exampleGraph.png')
# Define a layout for the graph
layout = g.layout("circle") # Layout in a circular arrangement
# Plot the graph with labels and custom options
plot(
g,
layout=layout,
vertex_label=g.vs["name"], # Label vertices
vertex_color="lightblue", # Vertex color
edge_width=g.es["weight"], # Edge width based on weight
vertex_size=30, # Vertex size
edge_color="grey", # Edge color
bbox=(300, 300), # Size of the plot
margin=20 # Margin around the plot
)
# Save the plotted graph to a file
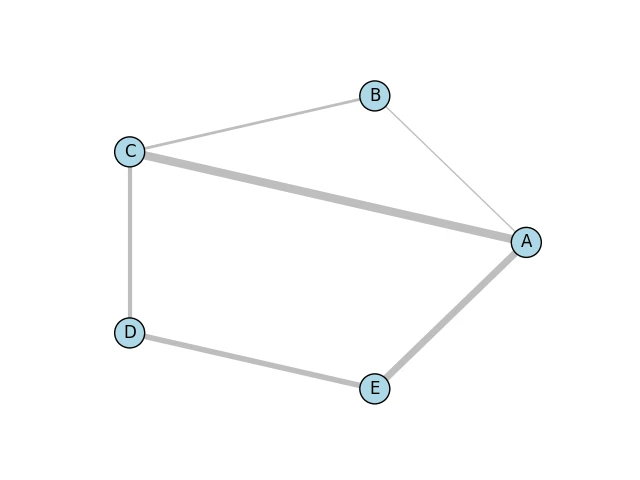
plot(g, layout=layout, bbox=(300, 300), margin=20).save('exampleGraph.png') 输出的图形
下面是一个借助 Matplotlib 库和 Cairo 库的 Python 绑定生成的简单图像。
高级图操作
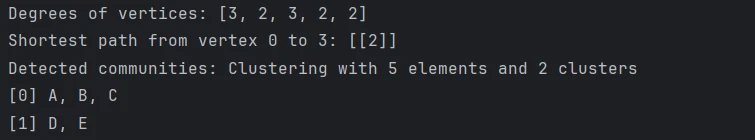
执行各种图操作和分析,如计算中心性、找到社区或识别最短路径:
# Calculate degree centrality for each vertex
degrees = g.degree()
print("Degrees of vertices:", degrees)

# Compute shortest path between two vertices that don't have a predefined distance
shortest_path = g.shortest_paths_dijkstra(source=0, target=3)
print("Shortest path from vertex 0 to 3:", shortest_path)

# Detect communities using the Louvain method
communities = g.community_multilevel()
print("Detected communities:", communities)
# Calculate degree centrality for each vertex
degrees = g.degree()
print("Degrees of vertices:", degrees)
# Compute shortest path between two vertices that don't have a predefined distance
shortest_path = g.shortest_paths_dijkstra(source=0, target=3)
print("Shortest path from vertex 0 to 3:", shortest_path)
# Detect communities using the Louvain method
communities = g.community_multilevel()
print("Detected communities:", communities)控制台输出
IronPDF 简介
我们甚至可以使用 IronPDF Python 模块以编程方式生成和编辑 PDF。 使用这个库,您将拥有从 HTML 创建 PDF 文档的巨大能力,合并两个或更多的 PDF 文档,甚至利用现有的 PDF 并对其进行修改,包括文本、照片和注释。 IronPDF 使您能够从任何 HTML 站点或 Web 内容生成专业质量的 PDF,非常适合生成报告、发票和其他具有预设样式的文档。
它的一些高级功能包括编辑页面布局、文档加密和从 PDF 中提取文本。 如果开发人员能够更好地处理 PDF,将会有助于进一步提高您的产品的一般实用性。
安装 IronPDF 库
您可以使用以下命令安装允许 Python 接口启用 IronPDF 功能的包:
pip install ironpdf
将 igraph 与 IronPDF 集成
在 Python 中合并 igraph 和 IronPDF 的步骤如下:首先,您将使用 igraph 创建一个图并显示它。 然后,将生成的可视化转换为 PDF。
from igraph import Graph, plot
import matplotlib.pyplot as plt
from ironpdf import ImageToPdfConverter, License
import warnings

# Suppress warnings for cleaner output
warnings.filterwarnings('ignore')

# Ensure that you have replaced the string with your own license key
License.LicenseKey = "YOUR LICENSE KEY GOES HERE"

# Create an empty graph
g = Graph()

# Add adjacent vertices (nodes)
g.add_vertices(5)  # Adding 5 vertices

# Add edges (connections between vertices)
g.add_edges([(0, 1), (1, 2), (2, 3), (3, 4), (4, 0), (0, 2)])  # Adding edges

# Add vertex and edge attributes
g.vs["name"] = ["A", "B", "C", "D", "E"]  # Vertex labels
g.es["weight"] = [1, 2, 3, 4, 5, 6]  # Edge weights

# Define a layout for the graph
layout = g.layout("circle")  # Layout in a circular arrangement

# Create a plot using matplotlib
fig, ax = plt.subplots()

# Plot the graph with specified layout and styles
plot(
    g,
    target=ax,
    layout=layout,
    vertex_label=g.vs["name"],  # Label vertices
    vertex_color="lightblue",   # Vertex color
    edge_width=g.es["weight"],  # Edge width based on weight
    vertex_size=30,             # Vertex size
    edge_color="grey",          # Edge color
    bbox=(300, 300),            # Size of the plot
    margin=20                   # Margin around the plot
)

# Save the plot as a PNG image
plt.savefig('result.png')

# Convert the image to a PDF file
ImageToPdfConverter.ImageToPdf('result.png').SaveAs("result.pdf")
from igraph import Graph, plot
import matplotlib.pyplot as plt
from ironpdf import ImageToPdfConverter, License
import warnings
# Suppress warnings for cleaner output
warnings.filterwarnings('ignore')
# Ensure that you have replaced the string with your own license key
License.LicenseKey = "YOUR LICENSE KEY GOES HERE"
# Create an empty graph
g = Graph()
# Add adjacent vertices (nodes)
g.add_vertices(5) # Adding 5 vertices
# Add edges (connections between vertices)
g.add_edges([(0, 1), (1, 2), (2, 3), (3, 4), (4, 0), (0, 2)]) # Adding edges
# Add vertex and edge attributes
g.vs["name"] = ["A", "B", "C", "D", "E"] # Vertex labels
g.es["weight"] = [1, 2, 3, 4, 5, 6] # Edge weights
# Define a layout for the graph
layout = g.layout("circle") # Layout in a circular arrangement
# Create a plot using matplotlib
fig, ax = plt.subplots()
# Plot the graph with specified layout and styles
plot(
g,
target=ax,
layout=layout,
vertex_label=g.vs["name"], # Label vertices
vertex_color="lightblue", # Vertex color
edge_width=g.es["weight"], # Edge width based on weight
vertex_size=30, # Vertex size
edge_color="grey", # Edge color
bbox=(300, 300), # Size of the plot
margin=20 # Margin around the plot
)
# Save the plot as a PNG image
plt.savefig('result.png')
# Convert the image to a PDF file
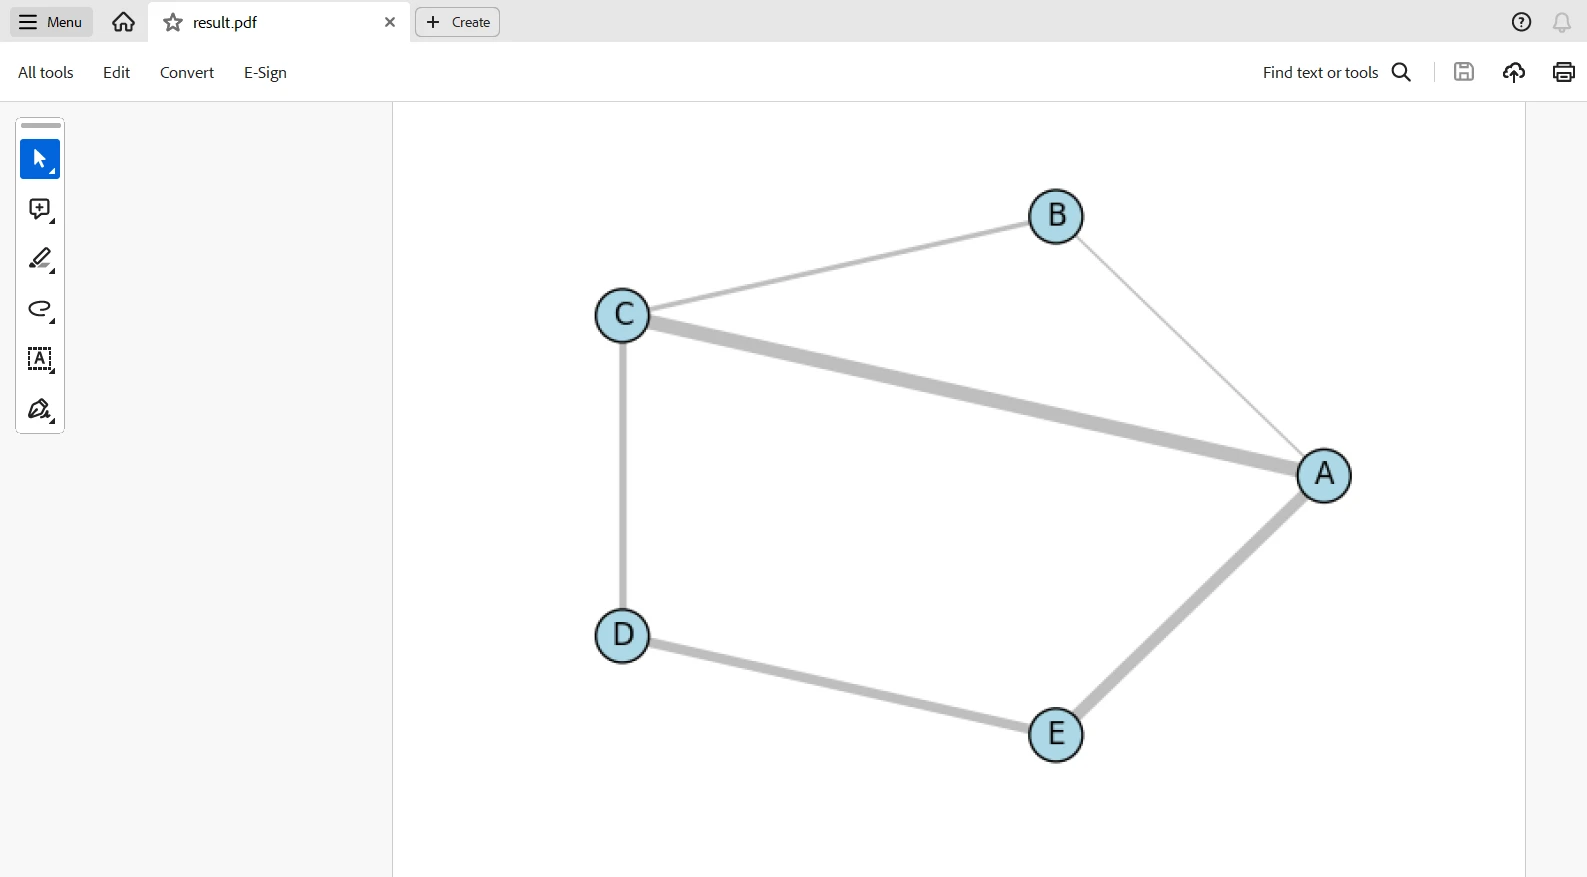
ImageToPdfConverter.ImageToPdf('result.png').SaveAs("result.pdf")这个脚本将通过 igraph 生成一个图,并通过 matplotlib 可视化,然后使用 IronPDF 将图表转换为 PDF。 这段代码将导入所有必要的库,并使用许可证密钥设置 IronPDF。 创建一个包含五个顶点和六个边的空图,并添加权重和标签以便清晰。
图形以圆形布局,并且绘图涉及 matplotlib 具有多个可视化属性,如顶点颜色和大小、边线宽度。 然后,结果作为图像文件result.png被保存。 最后,使用IronPDF的ImageToPdfConverter将其转换为PDF,result.pdf。 图形创建、可视化和 PDF 生成结合成一个工作流。
输出的 PDF
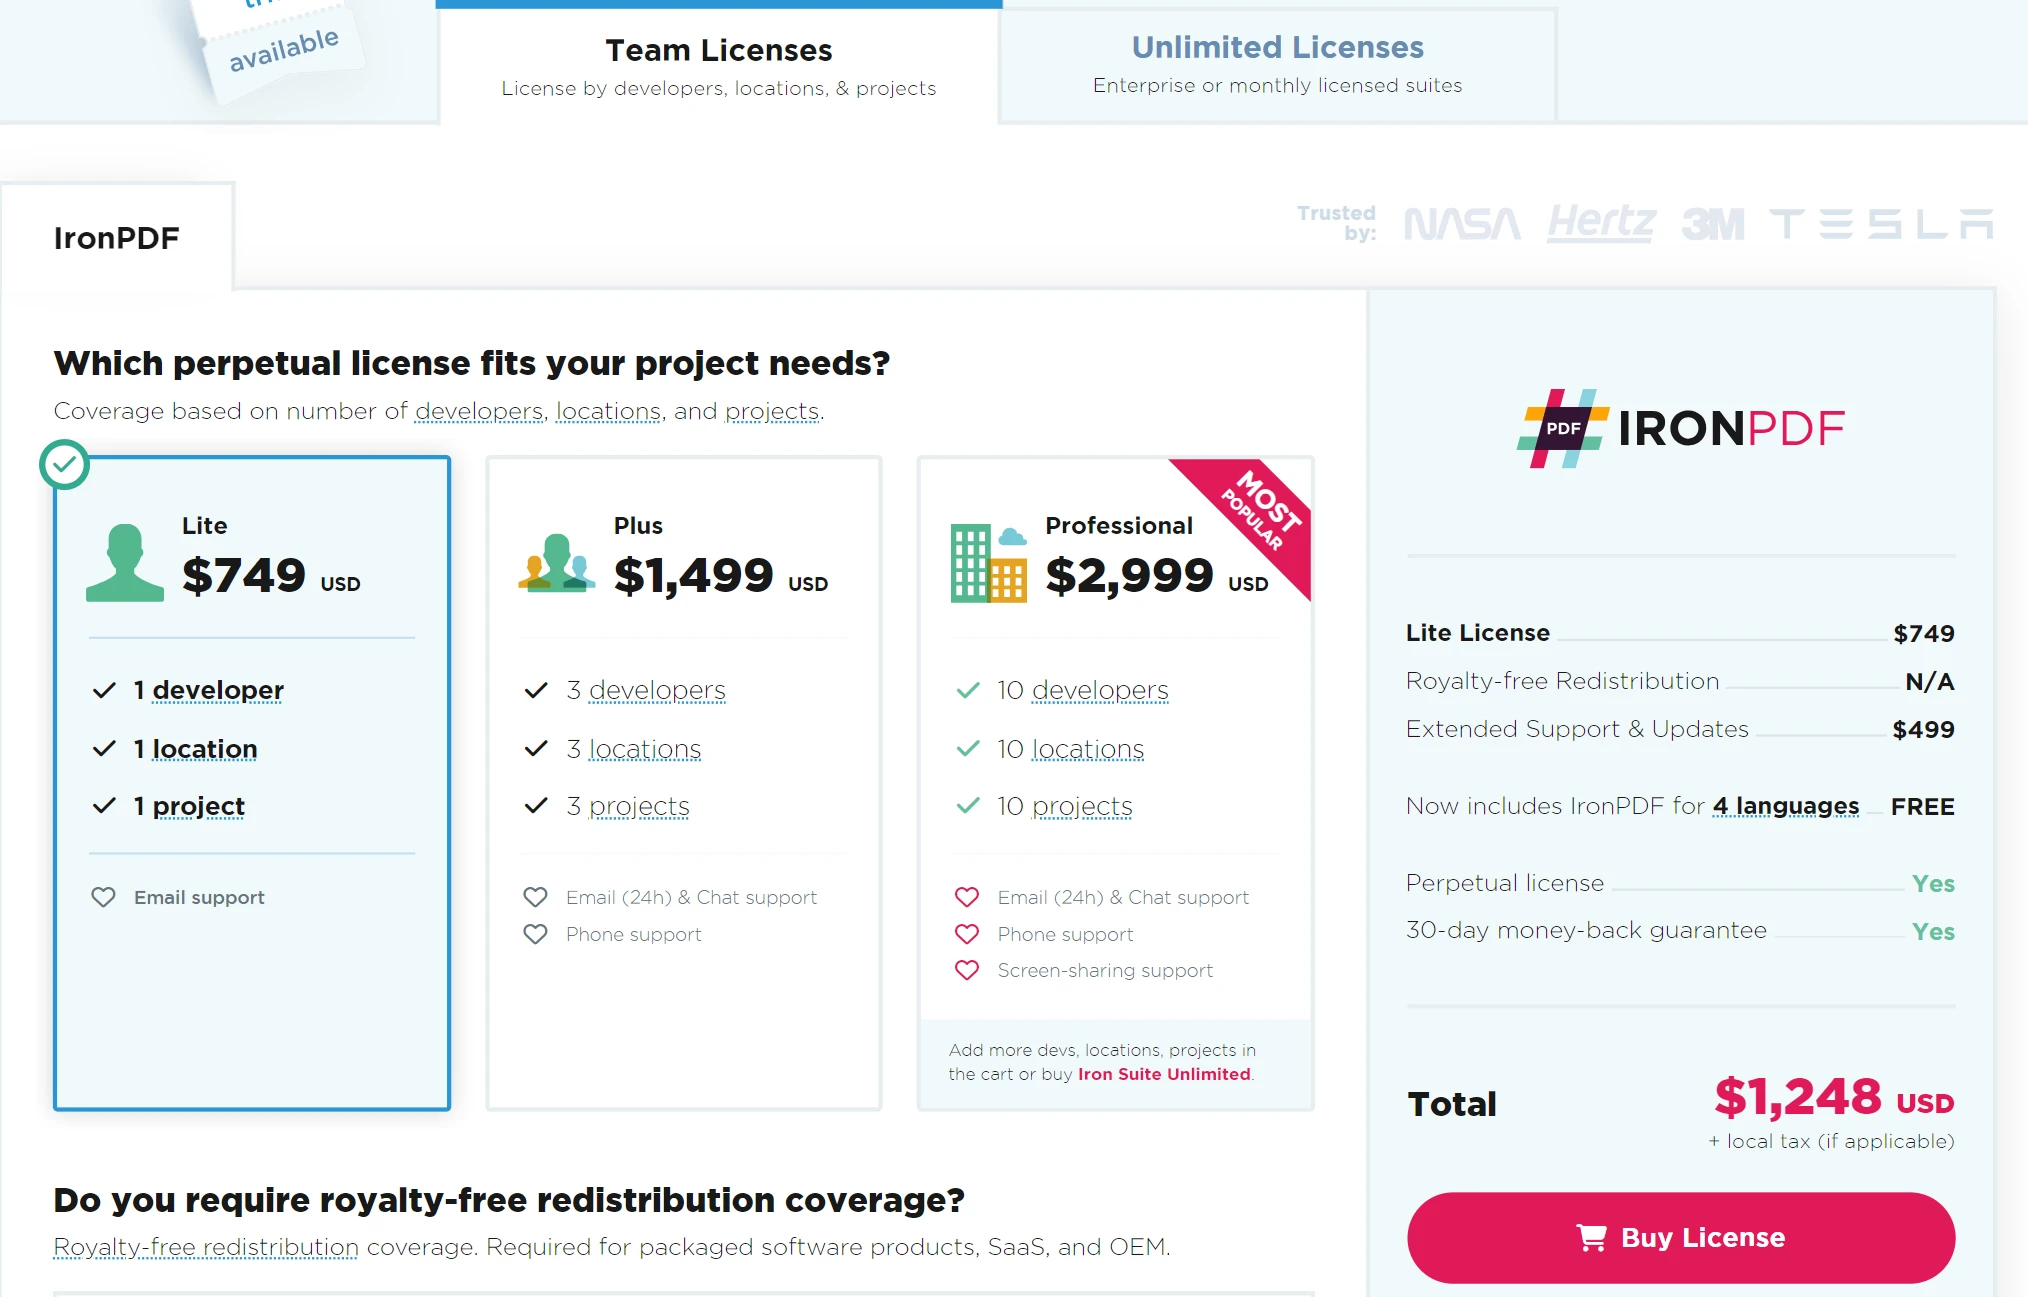
许可
需要许可证密钥使代码不显示水印。 您可以在此链接注册免费试用许可。 请注意,您无需提供身份验证即可注册。 您只需输入电子邮件地址即可注册免费试用版。
结论
借助IronPDF 和 igraph 的强大功能,您可以开发解决方案来可视化和呈现复杂的图数据。 通过 igraph,您可以轻松创建和分析复杂的网络,同时使用 IronPDF 将数据可视化进行无缝转换为专业级 PDF 文档。 这些结合的力量将帮助您开发全面的报告,包括图分析和视觉表示。
这种集成使得开发各种需要全面网络文档的应用成为可能,包括学术研究、商业分析和数据驱动的报告。 此外,它结合了高质量的文档输出和非常强大的图形操作能力。除此之外,Iron Software 提供了多种库,使开发跨平台和操作系统(如 Windows、Android、MAC、Linux 等)的应用程序变得更加容易。