d3 NPM (How It Works For Developers)
Data visualization is a crucial aspect of modern web development, helping to transform complex data sets into understandable and actionable insights. Among the various tools and libraries available, D3.js (Data-Driven Documents) stands out for its powerful and flexible approach to creating dynamic and interactive graphs for more than a decade among data practitioners. You can create robust, maintainable, and efficient data visualization applications when combining D3.js with React, a popular JavaScript library for building user interfaces.
This article will guide you through integrating D3.js with React and how it can help with visualizing data. Also, we will look into the IronPDF PDF generation library to generate PDFs from website URLs.
What is D3.js?
D3.js is a JavaScript library acting as a foundational building block to produce dynamic, interactive data-driven graphics visualizations in web browsers. It uses HTML, SVG, and CSS to bring data to life through various types of charts and graphs. D3 provides a powerful framework for binding data to a Document Object Model (DOM) and applying data-driven transformations to the document, and it is used as a base in many higher-level chart libraries.
What is React?
React is an open-source JavaScript library built by Facebook. It allows developers to create reusable UI components, manage the state efficiently, and update the DOM in response to changes in data.
Setting Up Your Environment
Make sure Node.js and npm are installed on your system. If not, you can download and install them from the official Node.js website.
Step 1: Create a New React Application
First, create a new React application using Create React App, a tool that sets up a new React project with a good default configuration. You can use the following commands in your terminal to accomplish this:
npx create-react-app d3-react-app
cd d3-react-app
npx create-react-app d3-react-app
cd d3-react-appStep 2: Install D3.js
Next, install the D3.js npm package through the following command:
npm install d3npm install d3Creating a Simple Bar Chart
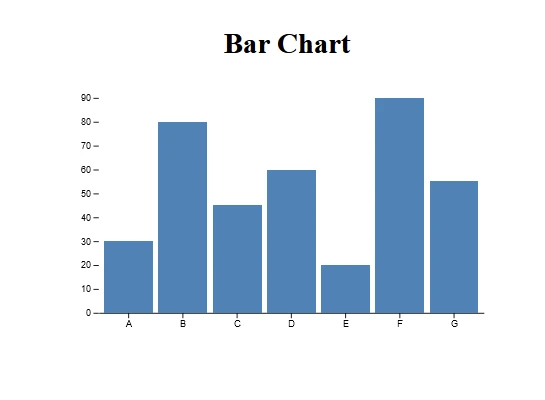
To demonstrate how to use D3.js with React, we’ll create a simple bar chart.
Step 1: Set Up the Component
Create a new component called BarChart.js in the src folder, and use the following code for the component:
// src/BarChart.js
import React, { useRef, useEffect } from 'react';
import * as d3 from 'd3';

// BarChart component
const BarChart = ({ data }) => {
  const svgRef = useRef();

  useEffect(() => {
    const svg = d3.select(svgRef.current);
    const width = 500;
    const height = 300;
    const margin = { top: 20, right: 30, bottom: 40, left: 40 };

    // Set up the SVG dimensions
    svg.attr('width', width).attr('height', height);

    // Define the x scale
    const x = d3.scaleBand()
      .domain(data.map(d => d.name))
      .range([margin.left, width - margin.right])
      .padding(0.1);

    // Define the y scale
    const y = d3.scaleLinear()
      .domain([0, d3.max(data, d => d.value)])
      .nice()
      .range([height - margin.bottom, margin.top]);

    // Define the x-axis
    const xAxis = g => g
      .attr('transform', `translate(0,${height - margin.bottom})`)
      .call(d3.axisBottom(x).tickSizeOuter(0));

    // Define the y-axis
    const yAxis = g => g
      .attr('transform', `translate(${margin.left},0)`)
      .call(d3.axisLeft(y))
      .call(g => g.select('.domain').remove());

    svg.append('g').call(xAxis);
    svg.append('g').call(yAxis);

    // Create bars
    svg.append('g')
      .selectAll('rect')
      .data(data)
      .join('rect')
      .attr('x', d => x(d.name))
      .attr('y', d => y(d.value))
      .attr('height', d => y(0) - y(d.value))
      .attr('width', x.bandwidth())
      .attr('fill', 'steelblue');
  }, [data]);

  return <svg ref={svgRef}></svg>;
};

export default BarChart;
// src/BarChart.js
import React, { useRef, useEffect } from 'react';
import * as d3 from 'd3';
// BarChart component
const BarChart = ({ data }) => {
const svgRef = useRef();
useEffect(() => {
const svg = d3.select(svgRef.current);
const width = 500;
const height = 300;
const margin = { top: 20, right: 30, bottom: 40, left: 40 };
// Set up the SVG dimensions
svg.attr('width', width).attr('height', height);
// Define the x scale
const x = d3.scaleBand()
.domain(data.map(d => d.name))
.range([margin.left, width - margin.right])
.padding(0.1);
// Define the y scale
const y = d3.scaleLinear()
.domain([0, d3.max(data, d => d.value)])
.nice()
.range([height - margin.bottom, margin.top]);
// Define the x-axis
const xAxis = g => g
.attr('transform', `translate(0,${height - margin.bottom})`)
.call(d3.axisBottom(x).tickSizeOuter(0));
// Define the y-axis
const yAxis = g => g
.attr('transform', `translate(${margin.left},0)`)
.call(d3.axisLeft(y))
.call(g => g.select('.domain').remove());
svg.append('g').call(xAxis);
svg.append('g').call(yAxis);
// Create bars
svg.append('g')
.selectAll('rect')
.data(data)
.join('rect')
.attr('x', d => x(d.name))
.attr('y', d => y(d.value))
.attr('height', d => y(0) - y(d.value))
.attr('width', x.bandwidth())
.attr('fill', 'steelblue');
}, [data]);
return <svg ref={svgRef}></svg>;
};
export default BarChart;Step 2: Use the Component
Now, use the BarChart component in your App.js file and pass some data to it.
// src/App.js
import React from 'react';
import BarChart from './BarChart';

const App = () => {
  const data = [
    { name: 'A', value: 30 },
    { name: 'B', value: 80 },
    { name: 'C', value: 45 },
    { name: 'D', value: 60 },
    { name: 'E', value: 20 },
    { name: 'F', value: 90 },
    { name: 'G', value: 55 },
  ];

  return (
    <div className="App">
      <h1>Bar Chart</h1>
      <BarChart data={data} />
    </div>
  );
};

export default App;
// src/App.js
import React from 'react';
import BarChart from './BarChart';
const App = () => {
const data = [
{ name: 'A', value: 30 },
{ name: 'B', value: 80 },
{ name: 'C', value: 45 },
{ name: 'D', value: 60 },
{ name: 'E', value: 20 },
{ name: 'F', value: 90 },
{ name: 'G', value: 55 },
];
return (
<div className="App">
<h1>Bar Chart</h1>
<BarChart data={data} />
</div>
);
};
export default App;Output
Introducing IronPDF
IronPDF is a robust npm package designed to facilitate PDF generation within Node.js applications. It enables unparalleled flexibility with the creation of PDF documents from HTML content, URLs, or existing PDF files. Whether generating invoices, reports, or other documents, IronPDF simplifies the process with its intuitive API and extensive feature set.
Key Features of IronPDF
HTML to PDF Conversion: Effortlessly convert HTML content into PDF documents, ideal for generating dynamic PDFs from web content.
URL to PDF Conversion: Create PDFs directly from URLs, capturing the content of web pages and saving them as PDF files programmatically.
PDF Manipulation: Merge, split, and manipulate existing PDF documents with ease. IronPDF allows you to append pages, split documents, and more.
PDF Security: Secure your PDF documents by encrypting them with passwords or applying digital signatures, protecting your sensitive documents from unauthorized access.
High-Quality Output: Produce high-quality PDF documents with precise rendering of text, images, and formatting, ensuring fidelity to the original content.
Cross-Platform Compatibility: IronPDF is compatible with various platforms, including Windows, Linux, and macOS, making it suitable for a wide range of development environments.
- Simple Integration: Easily integrate IronPDF into your Node.js applications using its npm package. The well-documented API makes it straightforward to incorporate PDF generation capabilities into your projects.
Whether you're building a web application, a server-side script, or a command-line tool, IronPDF empowers you to create professional-grade PDF documents efficiently and reliably.
IronPDF and D3 npm Package: PDF Generation Made Easy
Install Dependencies: First, create a new Next.js project (if you haven’t already) using the following command:
npx create-next-app@latest d3charts-pdf --use-npm --example "https://github.com/vercel/next-learn/tree/main/basics/learn-starter"npx create-next-app@latest d3charts-pdf --use-npm --example "https://github.com/vercel/next-learn/tree/main/basics/learn-starter"Next, navigate to your project directory:
cd d3charts-pdfcd d3charts-pdfFinally, install the required packages:
yarn add @ironsoftware/ironpdf @ironsoftware/ironpdf-engine-windows-x64
yarn add d3
yarn add @ironsoftware/ironpdf @ironsoftware/ironpdf-engine-windows-x64
yarn add d3PDF Generation API: The first step is to create a backend API to generate the PDF document. Since IronPDF only runs server-side, we need to create an API to call when users want to generate PDFs. Create a file in the path pages/api/pdf.js and add the content below:
// pages/api/pdf.js
import { IronPdfGlobalConfig, PdfDocument } from "@ironsoftware/ironpdf";

// Apply your IronPDF license key
IronPdfGlobalConfig.getConfig().licenseKey = "Your license key";

export default async function handler(req, res) {
  try {
    const url = req.query.url;
    const pdf = await PdfDocument.fromUrl(url);
    const data = await pdf.saveAsBuffer();
    console.error('data PDF:', data);
    res.setHeader('Content-Type', 'application/pdf');
    res.setHeader('Content-Disposition', 'attachment; filename=awesomeIron.pdf');
    res.send(data);
  } catch (error) {
    console.error('Error generating PDF:', error);
    res.status(500).end();
  }
}
// pages/api/pdf.js
import { IronPdfGlobalConfig, PdfDocument } from "@ironsoftware/ironpdf";
// Apply your IronPDF license key
IronPdfGlobalConfig.getConfig().licenseKey = "Your license key";
export default async function handler(req, res) {
try {
const url = req.query.url;
const pdf = await PdfDocument.fromUrl(url);
const data = await pdf.saveAsBuffer();
console.error('data PDF:', data);
res.setHeader('Content-Type', 'application/pdf');
res.setHeader('Content-Disposition', 'attachment; filename=awesomeIron.pdf');
res.send(data);
} catch (error) {
console.error('Error generating PDF:', error);
res.status(500).end();
}
}IronPDF requires a license key, which you can get from the trial license page and place it in the above code.
Add the following code to accept a URL from the user, and then generate a PDF from the given URL in the index.js file. The code also shows how to add a D3-generated graph and a backend API that will take in the user's URL.
// index.js
"use client";
import React, { useState } from 'react';
import D3BarChart from './d3BarChart';
import styles from "../../styles/Home.module.css";
export default function D3Demo() {
const [text, setText] = useState("");
const data = [
{ name: 'A', value: 30 },
{ name: 'B', value: 80 },
{ name: 'C', value: 45 },
{ name: 'D', value: 60 },
{ name: 'E', value: 20 },
{ name: 'F', value: 90 },
{ name: 'G', value: 55 },
];
const generatePdf = async () => {
try {
const response = await fetch("/api/pdf?url=" + text, {
method: "GET",
});
const blob = await response.blob();
const url = window.URL.createObjectURL(new Blob([blob]));
const link = document.createElement("a");
link.href = url;
link.setAttribute("download", "awesomeIron.pdf");
document.body.appendChild(link);
link.click();
link.parentNode.removeChild(link);
} catch (error) {
console.error("Error generating PDF:", error);
}
};
const handleChange = (event) => {
setText(event.target.value);
};
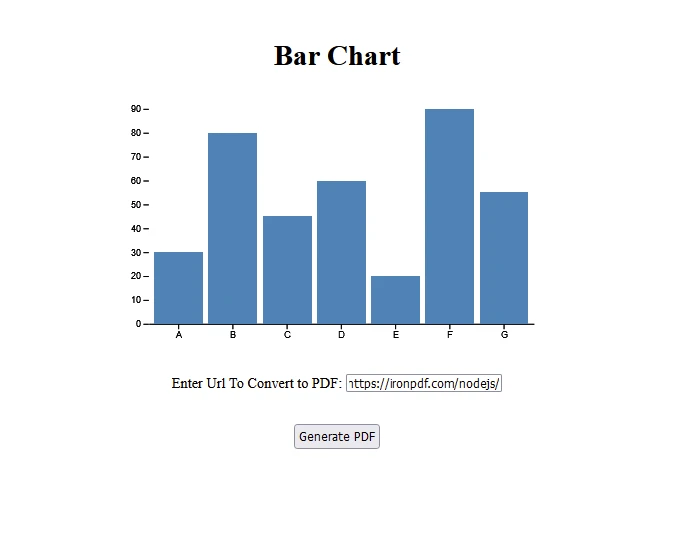
return (
<div className={styles.container}>
<h1>Bar Chart</h1>
<D3BarChart data={data} />
<p>
<span>Enter URL To Convert to PDF:</span>{" "}
<input type="text" value={text} onChange={handleChange} />
</p>
<button style={{ margin: 20, padding: 5 }} onClick={generatePdf}>
Generate PDF
</button>
</div>
);
}// index.js
"use client";
import React, { useState } from 'react';
import D3BarChart from './d3BarChart';
import styles from "../../styles/Home.module.css";
export default function D3Demo() {
const [text, setText] = useState("");
const data = [
{ name: 'A', value: 30 },
{ name: 'B', value: 80 },
{ name: 'C', value: 45 },
{ name: 'D', value: 60 },
{ name: 'E', value: 20 },
{ name: 'F', value: 90 },
{ name: 'G', value: 55 },
];
const generatePdf = async () => {
try {
const response = await fetch("/api/pdf?url=" + text, {
method: "GET",
});
const blob = await response.blob();
const url = window.URL.createObjectURL(new Blob([blob]));
const link = document.createElement("a");
link.href = url;
link.setAttribute("download", "awesomeIron.pdf");
document.body.appendChild(link);
link.click();
link.parentNode.removeChild(link);
} catch (error) {
console.error("Error generating PDF:", error);
}
};
const handleChange = (event) => {
setText(event.target.value);
};
return (
<div className={styles.container}>
<h1>Bar Chart</h1>
<D3BarChart data={data} />
<p>
<span>Enter URL To Convert to PDF:</span>{" "}
<input type="text" value={text} onChange={handleChange} />
</p>
<button style={{ margin: 20, padding: 5 }} onClick={generatePdf}>
Generate PDF
</button>
</div>
);
}Remember to define the D3BarChart component:
// d3BarChart.js
"use client";
import React, { useRef, useEffect } from 'react';
import * as d3 from 'd3';

// D3BarChart component
export default function D3BarChart({ data }) {
  const svgRef = useRef(); // ref svg element

  useEffect(() => {
    const svg = d3.select(svgRef.current);
    const width = 500;
    const height = 300;
    const margin = { top: 20, right: 30, bottom: 40, left: 40 };

    // Set up the SVG dimensions
    svg.attr('width', width).attr('height', height);

    // Define the x scale
    const x = d3.scaleBand()
      .domain(data.map(d => d.name))
      .range([margin.left, width - margin.right])
      .padding(0.1);

    // Define the y scale
    const y = d3.scaleLinear()
      .domain([0, d3.max(data, d => d.value)])
      .nice()
      .range([height - margin.bottom, margin.top]);

    // Define the x-axis
    const xAxis = g => g
      .attr('transform', `translate(0,${height - margin.bottom})`)
      .call(d3.axisBottom(x).tickSizeOuter(0));

    // Define the y-axis
    const yAxis = g => g
      .attr('transform', `translate(${margin.left},0)`)
      .call(d3.axisLeft(y))
      .call(g => g.select('.domain').remove());

    svg.append('g').call(xAxis);
    svg.append('g').call(yAxis);

    // Create bars
    svg.append('g')
      .selectAll('rect')
      .data(data)
      .join('rect')
      .attr('x', d => x(d.name))
      .attr('y', d => y(d.value))
      .attr('height', d => y(0) - y(d.value))
      .attr('width', x.bandwidth())
      .attr('fill', 'steelblue');
  }, [data]);

  return <svg ref={svgRef}></svg>;
}
// d3BarChart.js
"use client";
import React, { useRef, useEffect } from 'react';
import * as d3 from 'd3';
// D3BarChart component
export default function D3BarChart({ data }) {
const svgRef = useRef(); // ref svg element
useEffect(() => {
const svg = d3.select(svgRef.current);
const width = 500;
const height = 300;
const margin = { top: 20, right: 30, bottom: 40, left: 40 };
// Set up the SVG dimensions
svg.attr('width', width).attr('height', height);
// Define the x scale
const x = d3.scaleBand()
.domain(data.map(d => d.name))
.range([margin.left, width - margin.right])
.padding(0.1);
// Define the y scale
const y = d3.scaleLinear()
.domain([0, d3.max(data, d => d.value)])
.nice()
.range([height - margin.bottom, margin.top]);
// Define the x-axis
const xAxis = g => g
.attr('transform', `translate(0,${height - margin.bottom})`)
.call(d3.axisBottom(x).tickSizeOuter(0));
// Define the y-axis
const yAxis = g => g
.attr('transform', `translate(${margin.left},0)`)
.call(d3.axisLeft(y))
.call(g => g.select('.domain').remove());
svg.append('g').call(xAxis);
svg.append('g').call(yAxis);
// Create bars
svg.append('g')
.selectAll('rect')
.data(data)
.join('rect')
.attr('x', d => x(d.name))
.attr('y', d => y(d.value))
.attr('height', d => y(0) - y(d.value))
.attr('width', x.bandwidth())
.attr('fill', 'steelblue');
}, [data]);
return <svg ref={svgRef}></svg>;
}Code Explanation:
- We create a Next.js app and add necessary packages, IronPDF and D3.
- Then we create the BarChart component using D3.
- Add an input and button to generate the PDF document.
Outputs
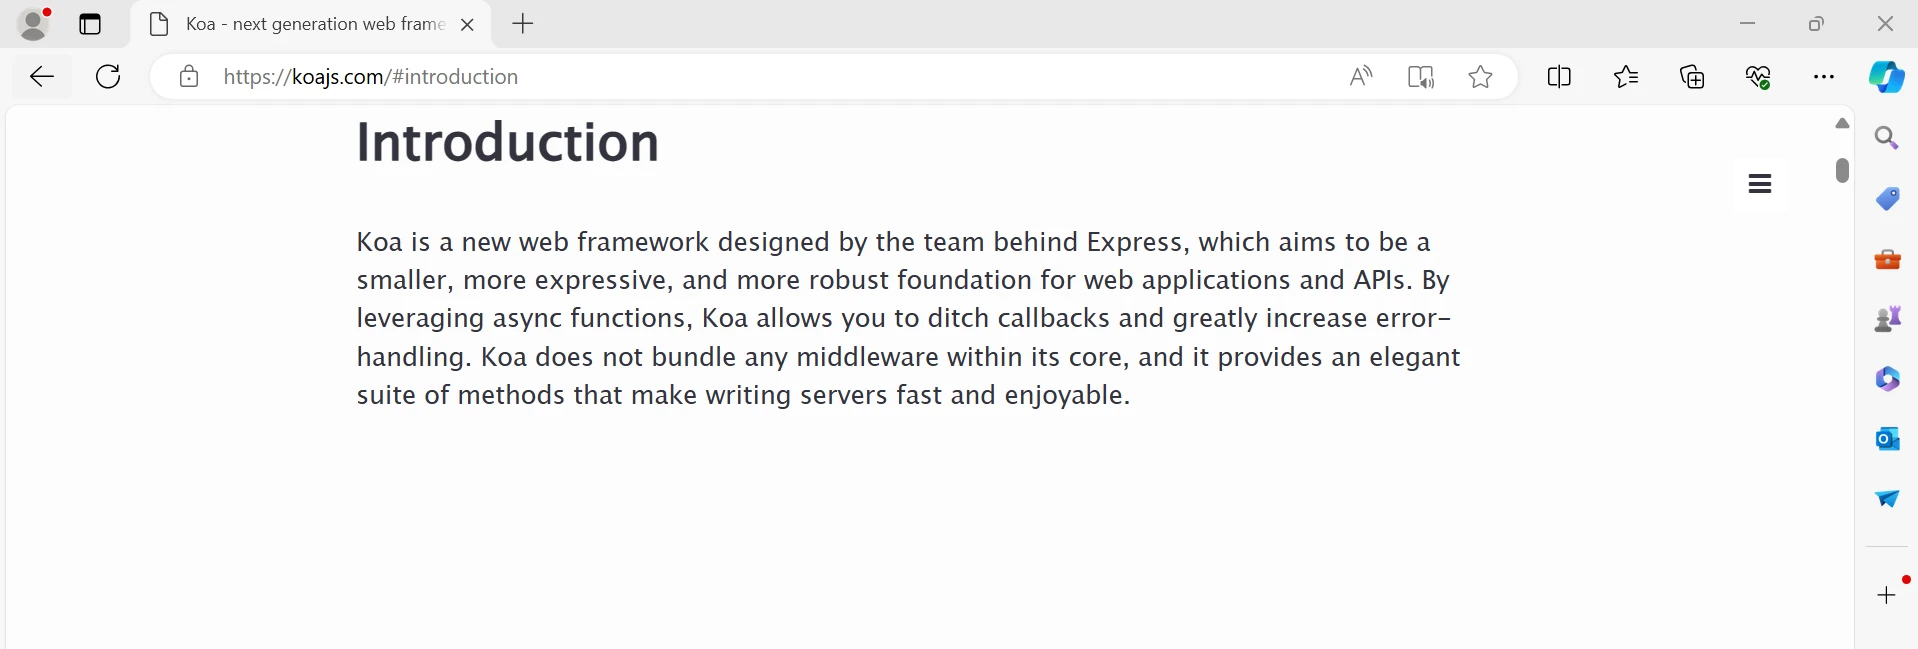
API:
PDF Generated from this [IronPDF URL](/nodejs/):
IronPDF License
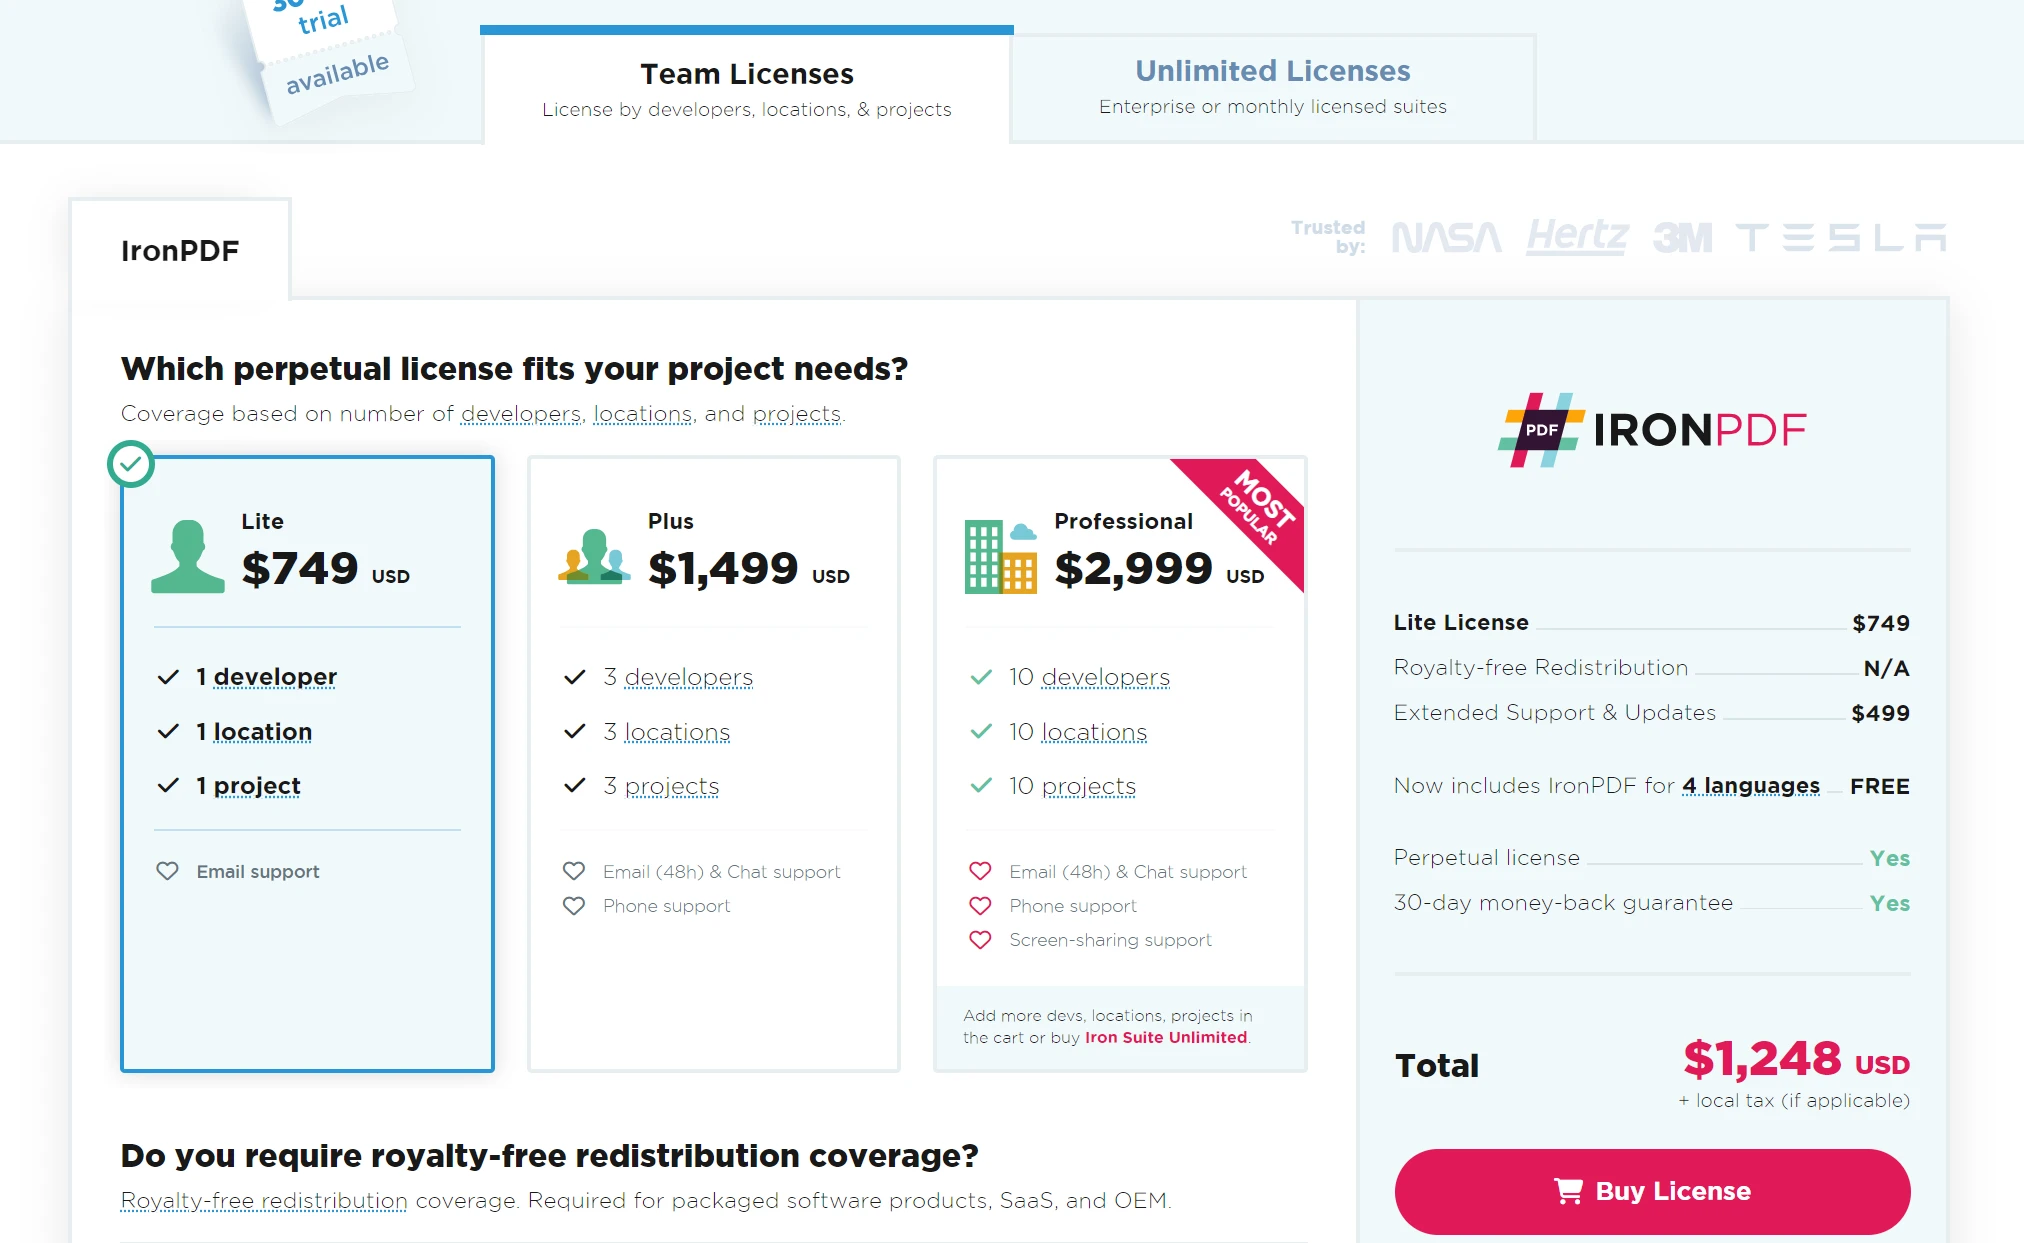
The IronPDF trial license allows users to check out its extensive features before purchase. More details on perpetual licensing can be found on the IronPDF Licensing page.
Place the License Key here:
import { IronPdfGlobalConfig, PdfDocument } from "@ironsoftware/ironpdf";
// Apply your IronPDF license key
IronPdfGlobalConfig.getConfig().licenseKey = "Add Your key here";
import { IronPdfGlobalConfig, PdfDocument } from "@ironsoftware/ironpdf";
// Apply your IronPDF license key
IronPdfGlobalConfig.getConfig().licenseKey = "Add Your key here";Conclusion
By combining D3.js with React, you can leverage the strengths of both libraries to create powerful and interactive data visualizations. React provides a robust framework for building user interfaces, while D3.js offers extensive capabilities for data manipulation and visualization. Using NPM to manage dependencies ensures that your project is maintainable and scalable. This example of a simple bar chart is just the beginning; with these tools, you can create a wide variety of sophisticated and interactive data visualizations tailored to your specific needs.