recharts NPM (How It Works For Developers)
Creating interactive and dynamic data visualizations in modern web development is crucial for enhancing user experience and making data-driven decisions. Recharts, a composable, redefined chart library built on an independent React component, offers a robust and easy-to-use solution for creating such visualizations.
This article explores the features of Recharts, its advantages, and how to get started with it in your React applications. We will also look into the IronPDF library to generate a PDF from Website URLs or HTML strings, and we will see how it pairs nicely with Recharts to display the produced graphs.
Why Choose Recharts?
Recharts npm package stands out for several reasons:
- Ease of Use: Its declarative approach aligns well with React's component-based architecture, making it intuitive for developers already familiar with React.
- Composability: Recharts components are designed to be highly composable, allowing developers to build complex charts by combining simpler components.
- Customization: It provides a high degree of customization, enabling developers to tweak almost every aspect of their charts.
- Responsive and Adaptive: Recharts guarantees that charts are responsive and adapt well to different screen sizes and resolutions.
Getting Started with Recharts
Recharts is a composable charting library. Now, let's get started:
Installation
npm (recommended installation method)
To start using Recharts, you need to install it via npm or yarn. Ensure you have Node.js and npm installed, then run the following command in your project directory:
npm install rechartsnpm install rechartsYou could also install Recharts using the umd or dev build method as shown below:
Umd
The UMD build is also made available on unpkg.com:
<script src="https://unpkg.com/react/umd/react.production.min.js"></script>
<script src="https://unpkg.com/react-dom/umd/react-dom.production.min.js"></script>
<script src="https://unpkg.com/recharts/umd/Recharts.min.js"></script>
<script src="https://unpkg.com/react/umd/react.production.min.js"></script>
<script src="https://unpkg.com/react-dom/umd/react-dom.production.min.js"></script>
<script src="https://unpkg.com/recharts/umd/Recharts.min.js"></script>Dev build
git clone https://github.com/recharts/recharts.git
cd recharts
npm install
npm run build
git clone https://github.com/recharts/recharts.git
cd recharts
npm install
npm run buildDemo
Basic Usage
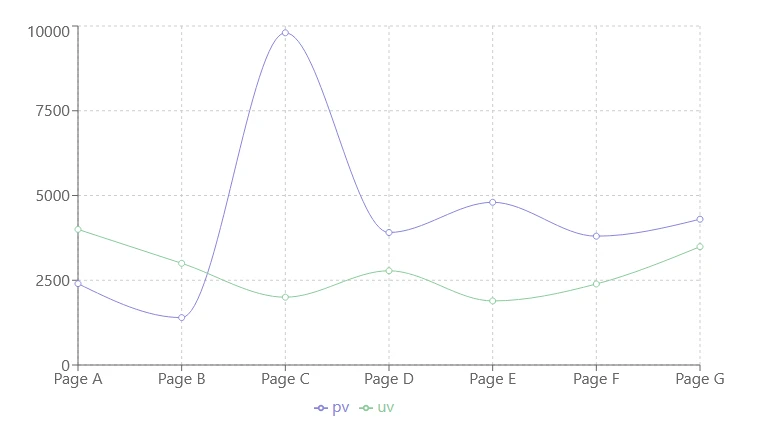
Let's create a simple line chart to visualize some sample data.
Import Recharts React Components: Import the necessary components from the Recharts library. You can cherry-pick Recharts modules for implementation from the release branch.
import React from 'react';
import { LineChart, Line, XAxis, YAxis, CartesianGrid, Tooltip, Legend, ResponsiveContainer } from 'recharts';
import React from 'react'; import { LineChart, Line, XAxis, YAxis, CartesianGrid, Tooltip, Legend, ResponsiveContainer } from 'recharts';JAVASCRIPTPrepare Data: Create a dataset to be displayed in the chart.
const data = [
{ name: 'Page A', uv: 4000, pv: 2400, amt: 2400 },
{ name: 'Page B', uv: 3000, pv: 1398, amt: 2210 },
{ name: 'Page C', uv: 2000, pv: 9800, amt: 2290 },
{ name: 'Page D', uv: 2780, pv: 3908, amt: 2000 },
{ name: 'Page E', uv: 1890, pv: 4800, amt: 2181 },
{ name: 'Page F', uv: 2390, pv: 3800, amt: 2500 },
{ name: 'Page G', uv: 3490, pv: 4300, amt: 2100 },
];
const data = [ { name: 'Page A', uv: 4000, pv: 2400, amt: 2400 }, { name: 'Page B', uv: 3000, pv: 1398, amt: 2210 }, { name: 'Page C', uv: 2000, pv: 9800, amt: 2290 }, { name: 'Page D', uv: 2780, pv: 3908, amt: 2000 }, { name: 'Page E', uv: 1890, pv: 4800, amt: 2181 }, { name: 'Page F', uv: 2390, pv: 3800, amt: 2500 }, { name: 'Page G', uv: 3490, pv: 4300, amt: 2100 }, ];JAVASCRIPTRender the Chart: Use the Recharts components to render the chart for visual testing platform enhancement.
const SimpleLineChart = () => ( <ResponsiveContainer width="100%" height={400}> <LineChart width={500} height={300} data={data} margin={{ top: 5, right: 30, left: 20, bottom: 5, }} > <CartesianGrid strokeDasharray="3 3" /> <XAxis dataKey="name" /> <YAxis /> <Tooltip /> <Legend /> <Line type="monotone" dataKey="pv" stroke="#8884d8" activeDot={{ r: 8 }} /> <Line type="monotone" dataKey="uv" stroke="#82ca9d" /> </LineChart> </ResponsiveContainer> ); export default SimpleLineChart;const SimpleLineChart = () => ( <ResponsiveContainer width="100%" height={400}> <LineChart width={500} height={300} data={data} margin={{ top: 5, right: 30, left: 20, bottom: 5, }} > <CartesianGrid strokeDasharray="3 3" /> <XAxis dataKey="name" /> <YAxis /> <Tooltip /> <Legend /> <Line type="monotone" dataKey="pv" stroke="#8884d8" activeDot={{ r: 8 }} /> <Line type="monotone" dataKey="uv" stroke="#82ca9d" /> </LineChart> </ResponsiveContainer> ); export default SimpleLineChart;JAVASCRIPT
Output
Customization and Advanced Features
In principle, Recharts offers various ways to customize and extend all the components:
- Custom Tooltips: You can create custom tooltips to display more detailed information.
- Animations: Add animations to make your charts more engaging.
- Interactivity: Implement interactive features such as click handlers to make your charts more interactive.
Different Chart Types: Recharts supports various chart types, including bar charts, pie charts, area charts, and more.
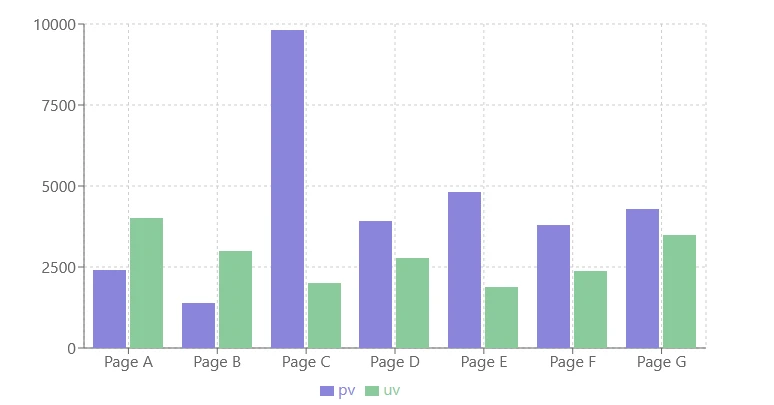
Example: Customizing a Bar Chart
Here’s how to create a customized bar chart:
- Import Necessary Components:
import React from 'react';
import { BarChart, Bar, XAxis, YAxis, CartesianGrid, Tooltip, Legend, ResponsiveContainer } from 'recharts';import React from 'react';
import { BarChart, Bar, XAxis, YAxis, CartesianGrid, Tooltip, Legend, ResponsiveContainer } from 'recharts';- Prepare Data:
const data = [
{ name: 'Page A', uv: 4000, pv: 2400, amt: 2400 },
{ name: 'Page B', uv: 3000, pv: 1398, amt: 2210 },
{ name: 'Page C', uv: 2000, pv: 9800, amt: 2290 },
{ name: 'Page D', uv: 2780, pv: 3908, amt: 2000 },
{ name: 'Page E', uv: 1890, pv: 4800, amt: 2181 },
{ name: 'Page F', uv: 2390, pv: 3800, amt: 2500 },
{ name: 'Page G', uv: 3490, pv: 4300, amt: 2100 },
];const data = [
{ name: 'Page A', uv: 4000, pv: 2400, amt: 2400 },
{ name: 'Page B', uv: 3000, pv: 1398, amt: 2210 },
{ name: 'Page C', uv: 2000, pv: 9800, amt: 2290 },
{ name: 'Page D', uv: 2780, pv: 3908, amt: 2000 },
{ name: 'Page E', uv: 1890, pv: 4800, amt: 2181 },
{ name: 'Page F', uv: 2390, pv: 3800, amt: 2500 },
{ name: 'Page G', uv: 3490, pv: 4300, amt: 2100 },
];- Render the Bar Chart:
const CustomizedBarChart = () => (
  <ResponsiveContainer width="100%" height={400}>
    <BarChart
      width={500}
      height={300}
      data={data}
      margin={{
        top: 20, right: 30, left: 20, bottom: 5,
      }}
    >
      <CartesianGrid strokeDasharray="3 3" />
      <XAxis dataKey="name" />
      <YAxis />
      <Tooltip />
      <Legend />
      <Bar dataKey="pv" fill="#8884d8" />
      <Bar dataKey="uv" fill="#82ca9d" />
    </BarChart>
  </ResponsiveContainer>
);
export default CustomizedBarChart;
const CustomizedBarChart = () => (
<ResponsiveContainer width="100%" height={400}>
<BarChart
width={500}
height={300}
data={data}
margin={{
top: 20, right: 30, left: 20, bottom: 5,
}}
>
<CartesianGrid strokeDasharray="3 3" />
<XAxis dataKey="name" />
<YAxis />
<Tooltip />
<Legend />
<Bar dataKey="pv" fill="#8884d8" />
<Bar dataKey="uv" fill="#82ca9d" />
</BarChart>
</ResponsiveContainer>
);
export default CustomizedBarChart;Output
Introducing IronPDF
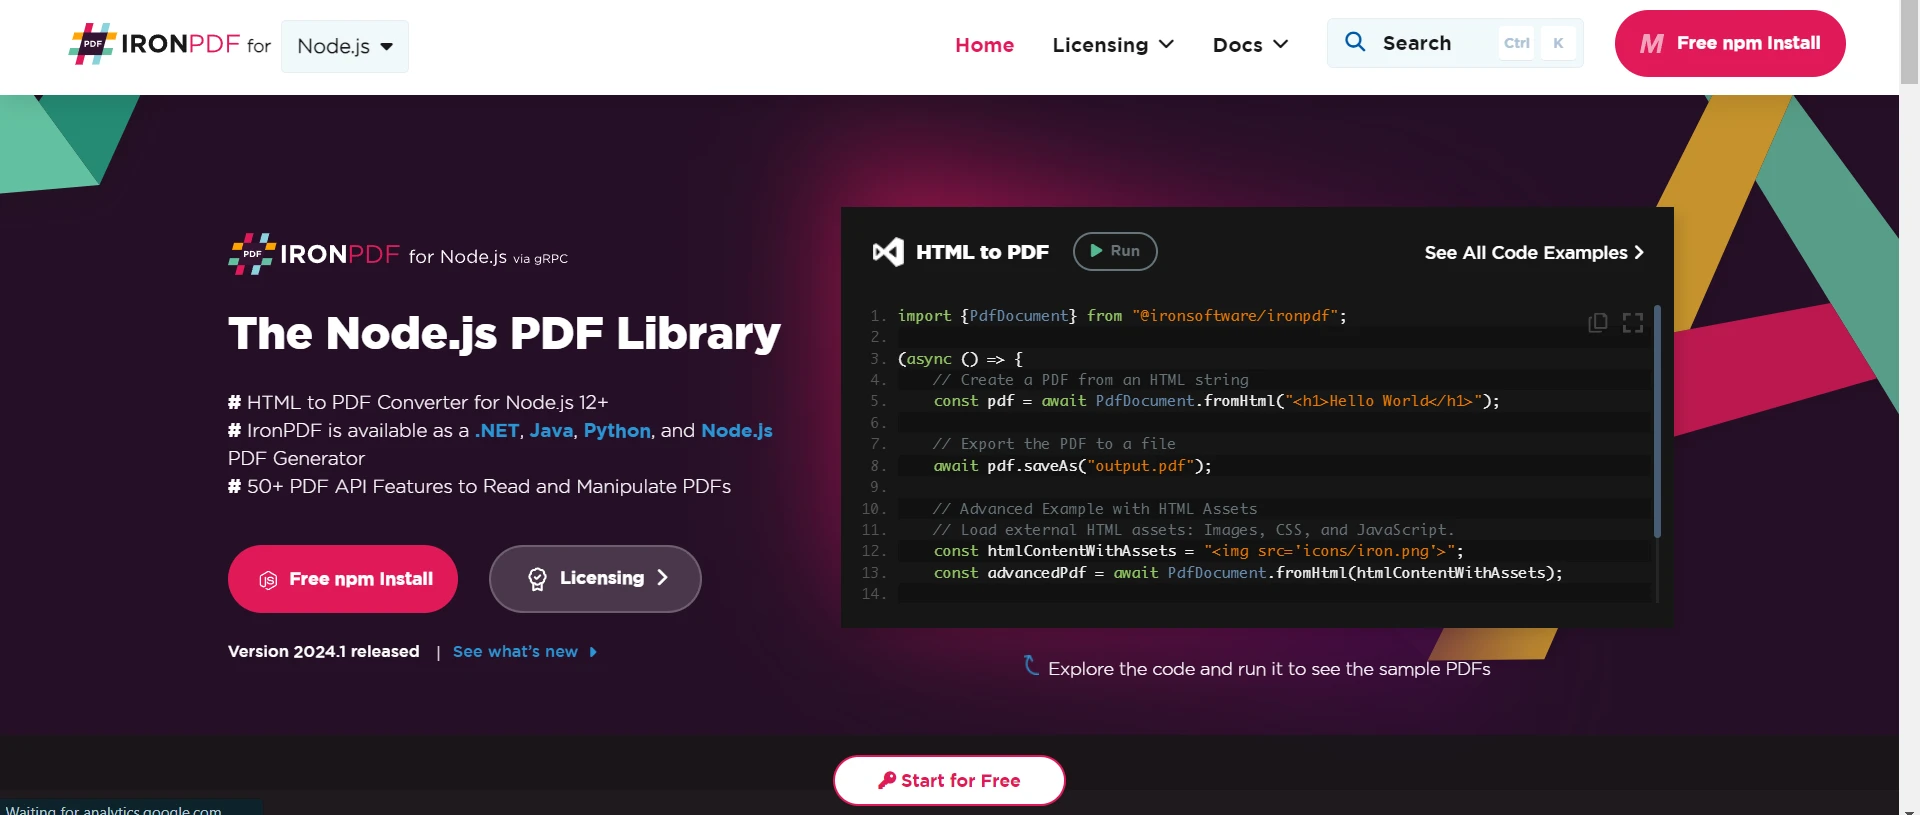
IronPDF for Node.js is a robust npm package designed to facilitate PDF generation within Node.js applications. It enables the creation of PDF documents from HTML content, URLs, or existing PDF files. Whether generating invoices, reports, or other documents, IronPDF simplifies the process with its intuitive API and extensive feature set.
Key Features of IronPDF
- HTML to PDF Conversion: Effortlessly convert HTML content into PDF documents, ideal for generating dynamic PDFs from web content.
- URL to PDF Conversion: Create PDFs directly from URLs, capturing the content of web pages and saving them as PDF files programmatically.
- PDF Manipulation: Merge, split, and manipulate existing PDF documents with ease. IronPDF allows you to append pages, split documents, and more.
- PDF Security: Secure your PDF documents by encrypting them with passwords or applying digital signatures, protecting your sensitive documents from unauthorized access.
- High-Quality Output: Produce high-quality PDF documents with precise rendering of text, images, and formatting, ensuring fidelity to the original content.
- Cross-Platform Compatibility: IronPDF is compatible with various platforms, including Windows, Linux, and macOS, making it suitable for a wide range of development environments.
- Simple Integration: Easily integrate IronPDF into your Node.js applications using its npm package. The well-documented API makes it straightforward to incorporate PDF generation capabilities into your projects.
Whether you're building a web application, a server-side script, or a command-line tool, IronPDF empowers you to create professional-grade PDF documents efficiently and reliably.
Generating a PDF with Recharts Using IronPDF
Install Dependencies: First, create a new Next.js project (if you haven’t already) using the following command, or refer here for more detailed instructions.
npx create-next-app@latest recharts-pdf --use-npm --example "https://github.com/vercel/next-learn/tree/main/basics/learn-starter"npx create-next-app@latest recharts-pdf --use-npm --example "https://github.com/vercel/next-learn/tree/main/basics/learn-starter"Next, navigate to your project directory:
cd recharts-pdfcd recharts-pdfInstall the required packages:
yarn add @ironsoftware/ironpdf @ironsoftware/ironpdf-engine-windows-x64
yarn add recharts
yarn add @ironsoftware/ironpdf @ironsoftware/ironpdf-engine-windows-x64
yarn add rechartsPDF Generation API: The first step is to create a backend API to generate the PDF document. Since IronPDF only runs server-side, we must make an API to call when users want to generate PDFs.
Create a file in path pages/api/pdf.js and add the below contents:
// pages/api/pdf.js
import {IronPdfGlobalConfig, PdfDocument} from "@ironsoftware/ironpdf";

// Apply your IronPDF license key
IronPdfGlobalConfig.getConfig().licenseKey = "Your license key";

export default async function handler(req, res) {
    try {
        const url = req.query.url;
        const pdf = await PdfDocument.fromUrl(url);
        const data = await pdf.saveAsBuffer();
        console.error('data PDF:', data);
        res.setHeader('Content-Type', 'application/pdf');
        res.setHeader('Content-Disposition', 'attachment; filename=awesomeIron.pdf');
        res.send(data);
    } catch (error) {
        console.error('Error generating PDF:', error);
        res.status(500).end();
    }
}
// pages/api/pdf.js
import {IronPdfGlobalConfig, PdfDocument} from "@ironsoftware/ironpdf";
// Apply your IronPDF license key
IronPdfGlobalConfig.getConfig().licenseKey = "Your license key";
export default async function handler(req, res) {
try {
const url = req.query.url;
const pdf = await PdfDocument.fromUrl(url);
const data = await pdf.saveAsBuffer();
console.error('data PDF:', data);
res.setHeader('Content-Type', 'application/pdf');
res.setHeader('Content-Disposition', 'attachment; filename=awesomeIron.pdf');
res.send(data);
} catch (error) {
console.error('Error generating PDF:', error);
res.status(500).end();
}
}IronPDF requires a license key which you can obtain from the Licensing page.
Add the below code to accept a URL from the user and generate a PDF from the URL to the index.js file.
"use client";
import { useState } from "react";
import Head from "next/head";
import styles from "../../styles/Home.module.css";
import { LineChart, Line, XAxis, YAxis, CartesianGrid, Tooltip, Legend, ResponsiveContainer, BarChart, Bar } from "recharts";
import { useCurrentPng } from "recharts-to-png";
import FileSaver from "file-saver";

const data = [
  { name: "Page A", uv: 4000, pv: 2400, amt: 2400 },
  { name: "Page B", uv: 3000, pv: 1398, amt: 2210 },
  { name: "Page C", uv: 2000, pv: 9800, amt: 2290 },
  { name: "Page D", uv: 2780, pv: 3908, amt: 2000 },
  { name: "Page E", uv: 1890, pv: 4800, amt: 2181 },
  { name: "Page F", uv: 2390, pv: 3800, amt: 2500 },
  { name: "Page G", uv: 3490, pv: 4300, amt: 2100 },
];

const barData = [
  { name: "Page A", uv: 4000, pv: 2400, amt: 2400 },
  { name: "Page B", uv: 3000, pv: 1398, amt: 2210 },
  { name: "Page C", uv: 2000, pv: 9800, amt: 2290 },
  { name: "Page D", uv: 2780, pv: 3908, amt: 2000 },
  { name: "Page E", uv: 1890, pv: 4800, amt: 2181 },
  { name: "Page F", uv: 2390, pv: 3800, amt: 2500 },
  { name: "Page G", uv: 3490, pv: 4300, amt: 2100 },
];

export default function RechartsDemo() {
  const [text, setText] = useState("");
  const [imgSrc, setImg] = useState("");
  // Implement useGenerateImage to get an image of any element (not just a Recharts component)
  const [getPng, { ref, isLoading }] = useCurrentPng();
  const handleDownload = async () => {
    const png = await getPng();
    // Verify that png is not undefined
    if (png) {
        setImg(png);
      // Download with FileSaver
      FileSaver.saveAs(png, "myChart.png");
    }
  };
  const generatePdf = async () => {
    try {
      const response = await fetch("/api/pdf?url=" + text, {
        method: "GET",
      });
      const blob = await response.blob();
      const url = window.URL.createObjectURL(new Blob([blob]));
      const link = document.createElement("a");
      link.href = url;
      link.setAttribute("download", "awesomeIron.pdf");
      document.body.appendChild(link);
      link.click();
      link.parentNode.removeChild(link);
    } catch (error) {
      console.error("Error generating PDF:", error);
    }
  };
  const handleChange = (event) => {
    setText(event.target.value);
  };
  return (
    <div className={styles.container} ref={ref}>
      <Head>
        <title>Generate PDF Using IronPDF</title>
        <link rel="icon" href="/favicon.ico" />
      </Head>
      <main>
        <div>
          <h1>Demo Recharts and Generate PDF Using IronPDF</h1>
          <ResponsiveContainer width="100%" height={400}>
            <LineChart
              ref={ref}
              width={500}
              height={300}
              data={data}
              margin={{
                top: 5,
                right: 30,
                left: 20,
                bottom: 5,
              }}
            >
              <CartesianGrid strokeDasharray="3 3" />
              <XAxis dataKey="name" />
              <YAxis />
              <Tooltip />
              <Legend />
              <Line
                type="monotone"
                dataKey="pv"
                stroke="#8884d8"
                activeDot={{ r: 8 }}
              />
              <Line type="monotone" dataKey="uv" stroke="#82ca9d" />
            </LineChart>
          </ResponsiveContainer>
          <ResponsiveContainer width="100%" height={400}>
            <BarChart
              width={500}
              height={300}
              data={barData}
              margin={{
                top: 20,
                right: 30,
                left: 20,
                bottom: 5,
              }}
            >
              <CartesianGrid strokeDasharray="3 3" />
              <XAxis dataKey="name" />
              <YAxis />
              <Tooltip />
              <Legend />
              <Bar dataKey="pv" fill="#8884d8" />
              <Bar dataKey="uv" fill="#82ca9d" />
            </BarChart>
          </ResponsiveContainer>
          <p>
            <span>Enter Url To Convert to PDF:</span>
            <input type="text" value={text} onChange={handleChange} />
          </p>
          <button style={{ margin: 20, padding: 5 }} onClick={generatePdf}>
            Generate PDF
          </button>
        </div>
      </main>
      <style jsx>{`
        main {
          padding: 5rem 0;
          flex: 1;
          display: flex;
          flex-direction: column;
          justify-content: top;
          align-items: center;
        }
        footer {
          width: 100%;
          height: 100px;
          border-top: 1px solid #eaeaea;
          display: flex;
          justify-content: center;
          align-items: center;
        }
        footer img {
          margin-left: 0.5rem;
        }
        footer a {
          display: flex;
          justify-content: center;
          align-items: center;
          text-decoration: none;
          color: inherit;
        }
        code {
          background: #fafafa;
          border-radius: 5px;
          padding: 0.75rem;
          font-size: 1.1rem;
          font-family: Menlo, Monaco, Lucida Console, Liberation Mono,
            DejaVu Sans Mono, Bitstream Vera Sans Mono, Courier New, monospace;
        }
      `}</style>
      <style jsx global>{`
        html,
        body {
          padding: 0;
          margin: 0;
          font-family: -apple-system, BlinkMacSystemFont, Segoe UI, Roboto,
            Oxygen, Ubuntu, Cantarell, Fira Sans, Droid Sans, Helvetica Neue,
            sans-serif;
        }
        * {
          box-sizing: border-box;
        }
      `}</style>
    </div>
  );
}
"use client";
import { useState } from "react";
import Head from "next/head";
import styles from "../../styles/Home.module.css";
import { LineChart, Line, XAxis, YAxis, CartesianGrid, Tooltip, Legend, ResponsiveContainer, BarChart, Bar } from "recharts";
import { useCurrentPng } from "recharts-to-png";
import FileSaver from "file-saver";
const data = [
{ name: "Page A", uv: 4000, pv: 2400, amt: 2400 },
{ name: "Page B", uv: 3000, pv: 1398, amt: 2210 },
{ name: "Page C", uv: 2000, pv: 9800, amt: 2290 },
{ name: "Page D", uv: 2780, pv: 3908, amt: 2000 },
{ name: "Page E", uv: 1890, pv: 4800, amt: 2181 },
{ name: "Page F", uv: 2390, pv: 3800, amt: 2500 },
{ name: "Page G", uv: 3490, pv: 4300, amt: 2100 },
];
const barData = [
{ name: "Page A", uv: 4000, pv: 2400, amt: 2400 },
{ name: "Page B", uv: 3000, pv: 1398, amt: 2210 },
{ name: "Page C", uv: 2000, pv: 9800, amt: 2290 },
{ name: "Page D", uv: 2780, pv: 3908, amt: 2000 },
{ name: "Page E", uv: 1890, pv: 4800, amt: 2181 },
{ name: "Page F", uv: 2390, pv: 3800, amt: 2500 },
{ name: "Page G", uv: 3490, pv: 4300, amt: 2100 },
];
export default function RechartsDemo() {
const [text, setText] = useState("");
const [imgSrc, setImg] = useState("");
// Implement useGenerateImage to get an image of any element (not just a Recharts component)
const [getPng, { ref, isLoading }] = useCurrentPng();
const handleDownload = async () => {
const png = await getPng();
// Verify that png is not undefined
if (png) {
setImg(png);
// Download with FileSaver
FileSaver.saveAs(png, "myChart.png");
}
};
const generatePdf = async () => {
try {
const response = await fetch("/api/pdf?url=" + text, {
method: "GET",
});
const blob = await response.blob();
const url = window.URL.createObjectURL(new Blob([blob]));
const link = document.createElement("a");
link.href = url;
link.setAttribute("download", "awesomeIron.pdf");
document.body.appendChild(link);
link.click();
link.parentNode.removeChild(link);
} catch (error) {
console.error("Error generating PDF:", error);
}
};
const handleChange = (event) => {
setText(event.target.value);
};
return (
<div className={styles.container} ref={ref}>
<Head>
<title>Generate PDF Using IronPDF</title>
<link rel="icon" href="/favicon.ico" />
</Head>
<main>
<div>
<h1>Demo Recharts and Generate PDF Using IronPDF</h1>
<ResponsiveContainer width="100%" height={400}>
<LineChart
ref={ref}
width={500}
height={300}
data={data}
margin={{
top: 5,
right: 30,
left: 20,
bottom: 5,
}}
>
<CartesianGrid strokeDasharray="3 3" />
<XAxis dataKey="name" />
<YAxis />
<Tooltip />
<Legend />
<Line
type="monotone"
dataKey="pv"
stroke="#8884d8"
activeDot={{ r: 8 }}
/>
<Line type="monotone" dataKey="uv" stroke="#82ca9d" />
</LineChart>
</ResponsiveContainer>
<ResponsiveContainer width="100%" height={400}>
<BarChart
width={500}
height={300}
data={barData}
margin={{
top: 20,
right: 30,
left: 20,
bottom: 5,
}}
>
<CartesianGrid strokeDasharray="3 3" />
<XAxis dataKey="name" />
<YAxis />
<Tooltip />
<Legend />
<Bar dataKey="pv" fill="#8884d8" />
<Bar dataKey="uv" fill="#82ca9d" />
</BarChart>
</ResponsiveContainer>
<p>
<span>Enter Url To Convert to PDF:</span>
<input type="text" value={text} onChange={handleChange} />
</p>
<button style={{ margin: 20, padding: 5 }} onClick={generatePdf}>
Generate PDF
</button>
</div>
</main>
<style jsx>{`
main {
padding: 5rem 0;
flex: 1;
display: flex;
flex-direction: column;
justify-content: top;
align-items: center;
}
footer {
width: 100%;
height: 100px;
border-top: 1px solid #eaeaea;
display: flex;
justify-content: center;
align-items: center;
}
footer img {
margin-left: 0.5rem;
}
footer a {
display: flex;
justify-content: center;
align-items: center;
text-decoration: none;
color: inherit;
}
code {
background: #fafafa;
border-radius: 5px;
padding: 0.75rem;
font-size: 1.1rem;
font-family: Menlo, Monaco, Lucida Console, Liberation Mono,
DejaVu Sans Mono, Bitstream Vera Sans Mono, Courier New, monospace;
}
`}</style>
<style jsx global>{`
html,
body {
padding: 0;
margin: 0;
font-family: -apple-system, BlinkMacSystemFont, Segoe UI, Roboto,
Oxygen, Ubuntu, Cantarell, Fira Sans, Droid Sans, Helvetica Neue,
sans-serif;
}
* {
box-sizing: border-box;
}
`}</style>
</div>
);
}Code Explanation
- API for PDF Generation: We create an endpoint at
pages/api/pdf.jsusing IronPDF to convert a URL into a PDF document. - Chart Components: The application includes both Line and Bar charts that display sample data.
- User Input and PDF Generation: The app provides an input field where users can enter a URL to convert to a PDF using the IronPDF library.
- Download PDF: When the 'Generate PDF' button is pressed, a PDF of the web page at the specified URL is generated and downloaded.
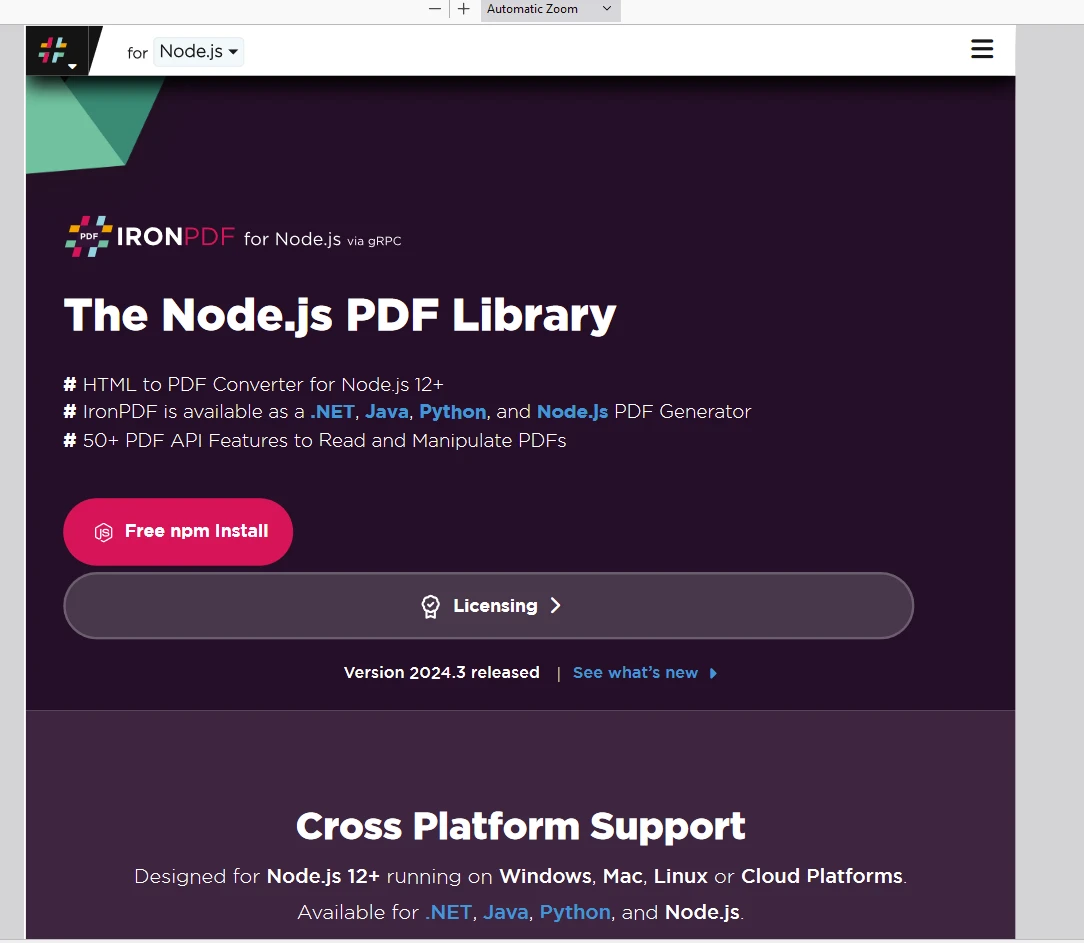
Output
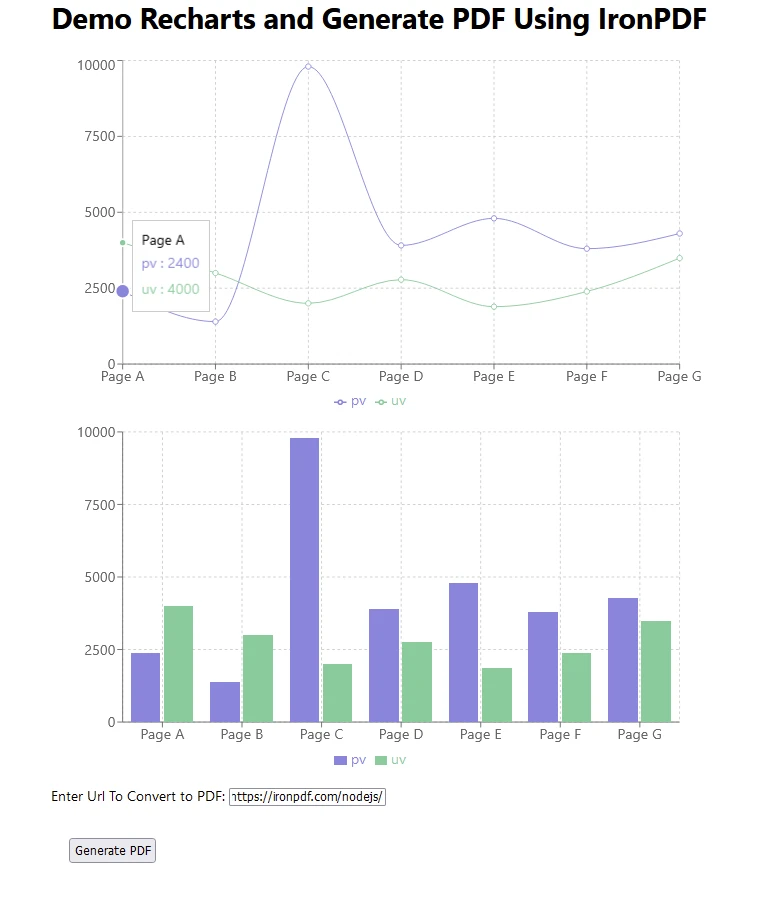
Below is the outputted PDF when the 'Generate PDF' button is pressed in the above output.
IronPDF License
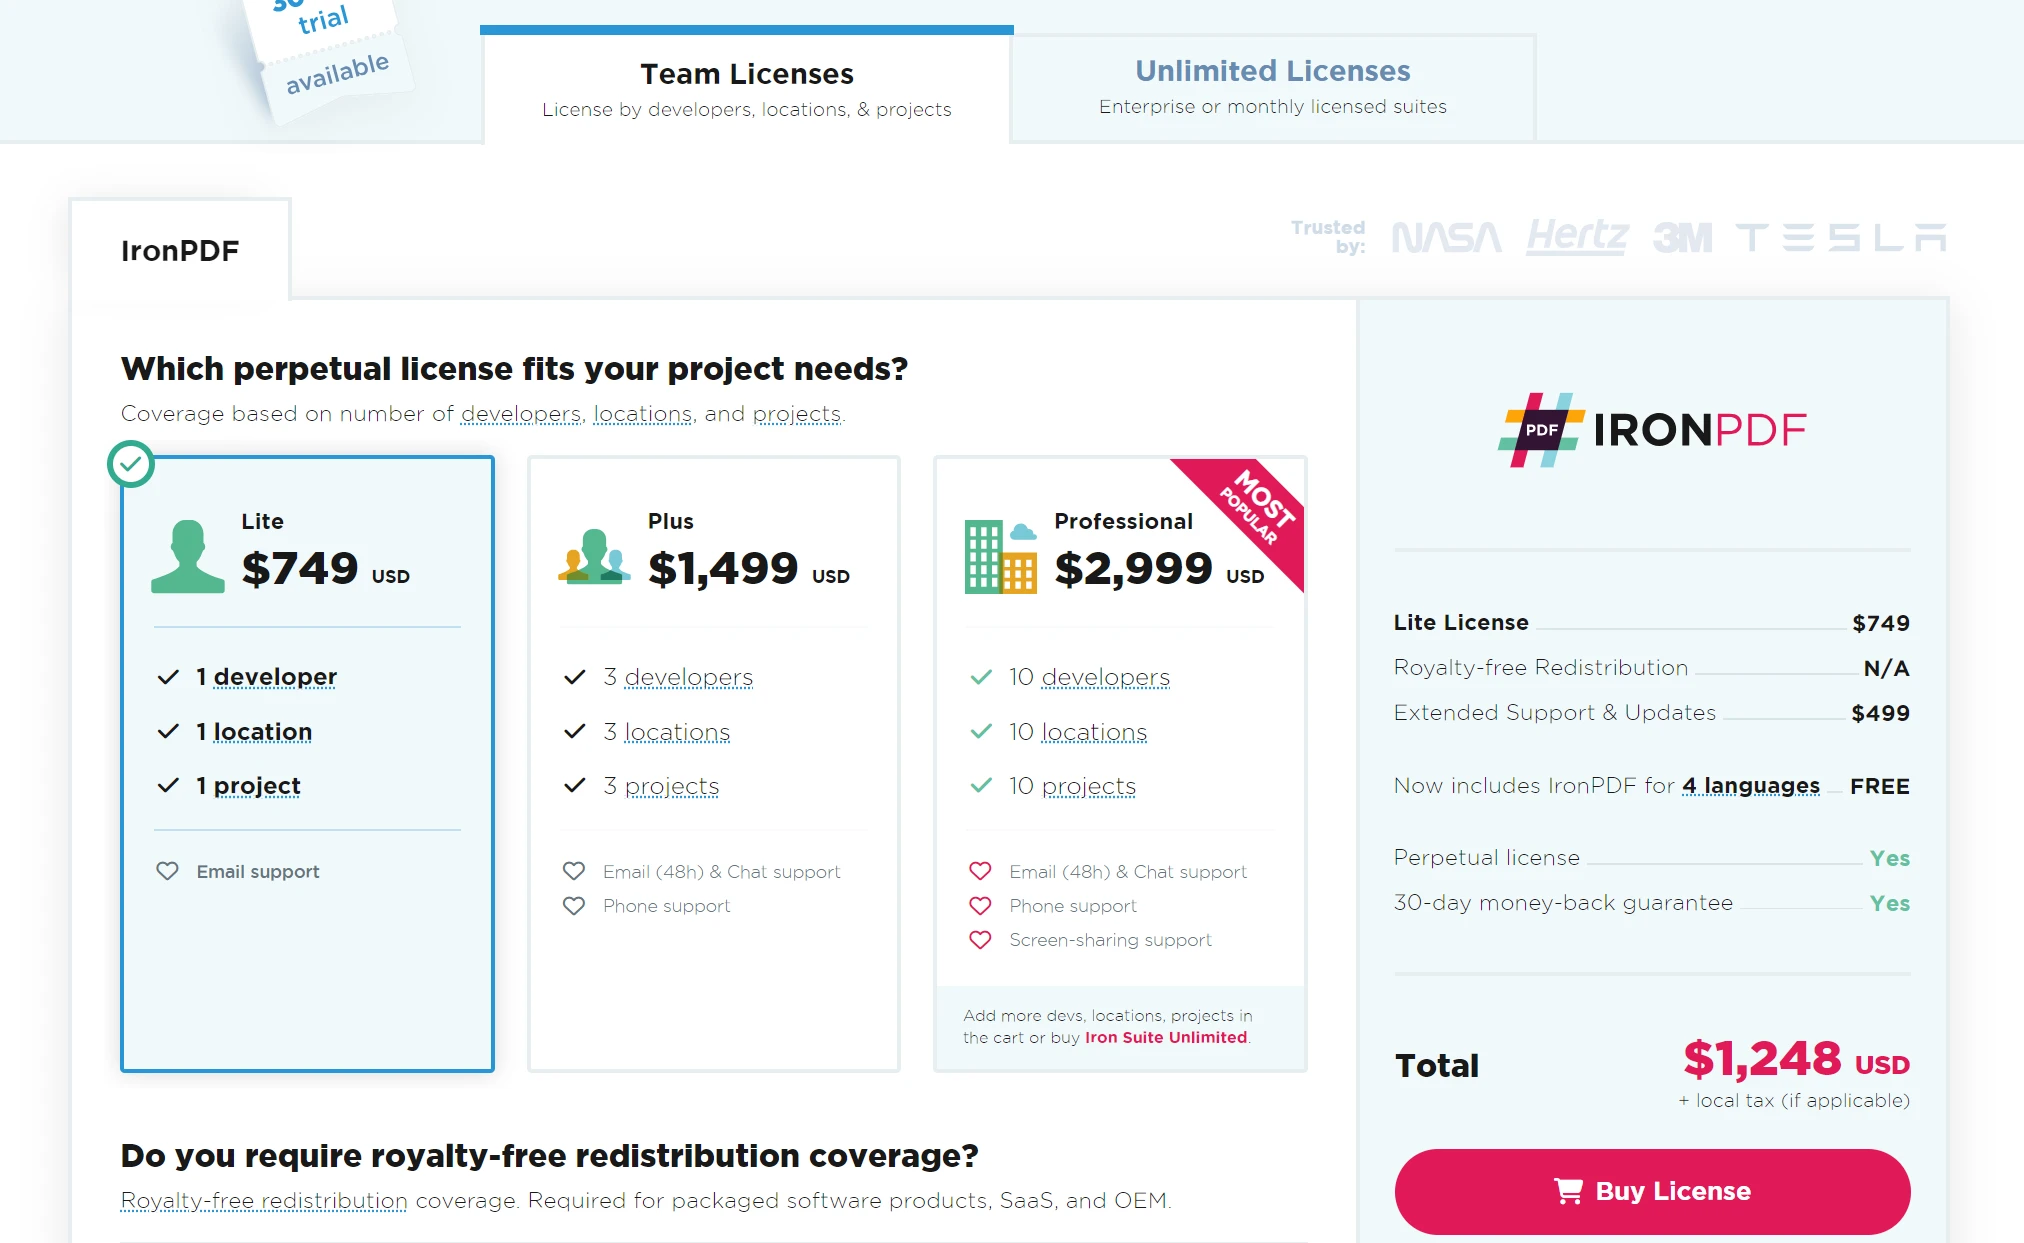
Obtain a free trial license key to check out IronPDF's extensive features before purchase. More details on perpetual licensing can be found on the license page.
Place the License Key here:
import {IronPdfGlobalConfig, PdfDocument} from "@ironsoftware/ironpdf";
// Apply your IronPDF license key
IronPdfGlobalConfig.getConfig().licenseKey = "Your license key";
import {IronPdfGlobalConfig, PdfDocument} from "@ironsoftware/ironpdf";
// Apply your IronPDF license key
IronPdfGlobalConfig.getConfig().licenseKey = "Your license key";Conclusion
Recharts is a powerful library that simplifies creating dynamic and interactive data visualizations in React applications. Its ease of use, composability, and extensive customization options make it an excellent choice for developers looking to enhance their applications with robust charts.
Whether you are building a simple line chart or a complex multi-series visualization, Recharts provides the tools you need to succeed. Give it a try in your next project and experience the benefits of seamless data visualization. IronPDF is a powerful PDF generation tool and can be used in conjunction with Recharts to display and share any graphs produced. Developers looking for an effective tool to help with PDF production and manipulation must try IronPDF.