Matplotlib Python Guide for Beginners
Data visualization is an essential tool for deriving insights from data and effectively communicating findings. Matplotlib, a widely used plotting library in Python, provides a flexible and intuitive interface for creating a wide range of static, interactive, and publication-quality visualizations with data points. In this article, we'll delve into Matplotlib in Python, exploring its features, capabilities, and practical examples to unleash the full potential of data visualization in Python. We will also learn about IronPDF, a PDF generation library from Iron Software.
Introduction to Matplotlib
Matplotlib is a comprehensive 2D plotting library for Python that produces high-quality figures in various formats and environments. Developed by John D. Hunter and maintained by an active community of contributors, Matplotlib contributes significantly to the versatility and robustness of data visualization in Python. It offers a versatile set of plotting functions for creating static plots like line plots, scatter plots, bar plots, histograms, heatmaps, and more. Matplotlib also supports interactive visualizations, including grid lines and bar charts, and can be used in web applications. Furthermore, it provides fine-grained control over plot elements, including axes, labels, legends, colors, and styles, allowing users to customize visualizations to their specific needs.
Key Features of Matplotlib
- Wide Range of Plot Types: Matplotlib supports a diverse range of plot types, including line plots, scatter plots, bar plots, histograms, pie charts, box plots, violin plots, contour plots, and 3D plots. This versatility enables users to visualize different types of data and relationships effectively.
- Flexible Plot Customization: Matplotlib provides extensive customization options for modifying plot elements such as axes, labels, ticks, colors, markers, and line styles. Users can customize plots using both procedural and object-oriented interfaces, allowing for fine-grained control over plot aesthetics.
- Publication-Quality Output: Matplotlib produces high-quality, publication-ready figures suitable for inclusion in scientific publications, reports, presentations, and websites. It supports various output formats, including PNG, PDF, SVG, and EPS. Furthermore, you can also create Python scripts in conjunction with Matplotlib to create interactive formats for web applications.
- Integration with Jupyter Notebooks: Matplotlib seamlessly integrates with Jupyter Notebooks, allowing users to create interactive and exploratory visualizations directly within the notebook environment. This integration facilitates interactive data analysis and storytelling workflows.
- Support for Multiple Backends: Matplotlib supports multiple rendering backends, including Tkinter, Qt, GTK, WX, and Agg, allowing users to choose the most suitable backend for their application or environment. This flexibility enables Matplotlib to be used in a wide range of desktop and web-based applications.
Installing Matplotlib
pip install matplotlibpip install matplotlibPractical Examples with Matplotlib
Let's explore some practical examples of using Matplotlib to create common visualizations with some simulated data points. Ensure you have Python version 3 or higher and graphical user interface toolkits installed. Now let's see the Python code:
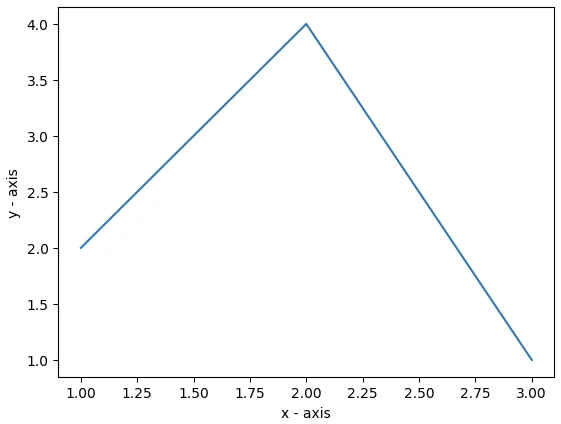
Line Plot:
import matplotlib.pyplot as plt  # Import Matplotlib

# Define data points for the plot
x = [1, 2, 3, 4, 5]
y = [2, 3, 5, 7, 11]

# Create a line plot
plt.plot(x, y)

# Add labels and title
plt.xlabel('X-axis')
plt.ylabel('Y-axis')
plt.title('Line Plot')

# Display the plot
plt.show()
import matplotlib.pyplot as plt # Import Matplotlib # Define data points for the plot x = [1, 2, 3, 4, 5] y = [2, 3, 5, 7, 11] # Create a line plot plt.plot(x, y) # Add labels and title plt.xlabel('X-axis') plt.ylabel('Y-axis') plt.title('Line Plot') # Display the plot plt.show()PYTHON
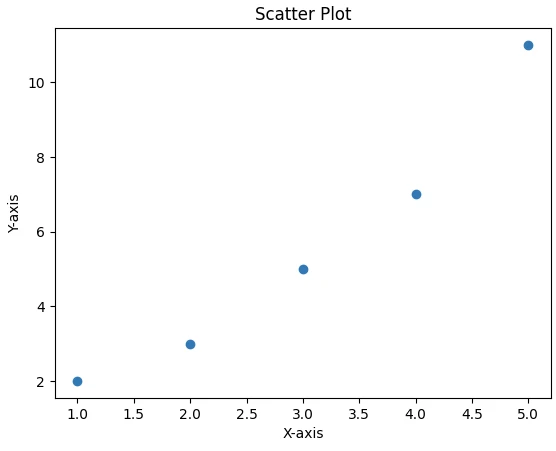
Scatter Plot:
import matplotlib.pyplot as plt  # Import Matplotlib

# Define data points for the plot
x = [1, 2, 3, 4, 5]
y = [2, 3, 5, 7, 11]

# Create a scatter plot
plt.scatter(x, y)

# Add labels and title
plt.xlabel('X-axis')
plt.ylabel('Y-axis')
plt.title('Scatter Plot')

# Display the plot
plt.show()
import matplotlib.pyplot as plt # Import Matplotlib # Define data points for the plot x = [1, 2, 3, 4, 5] y = [2, 3, 5, 7, 11] # Create a scatter plot plt.scatter(x, y) # Add labels and title plt.xlabel('X-axis') plt.ylabel('Y-axis') plt.title('Scatter Plot') # Display the plot plt.show()PYTHON
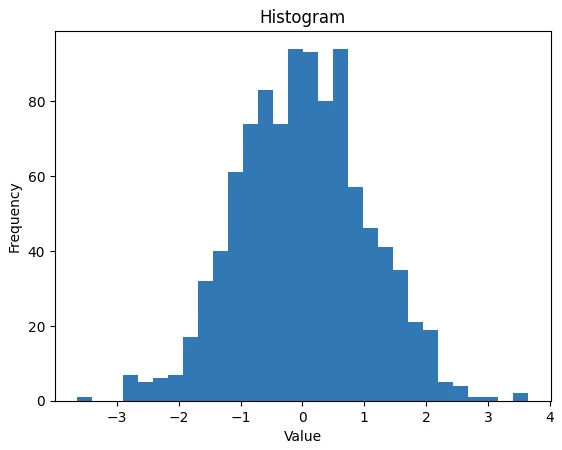
Histogram:
import matplotlib.pyplot as plt  # Import Matplotlib
import numpy as np  # Import NumPy for numerical operations

# Generate random data
data = np.random.randn(1000)

# Create a histogram plot
plt.hist(data, bins=30)

# Add labels and title
plt.xlabel('Value')
plt.ylabel('Frequency')
plt.title('Histogram')

# Display the plot
plt.show()
import matplotlib.pyplot as plt # Import Matplotlib import numpy as np # Import NumPy for numerical operations # Generate random data data = np.random.randn(1000) # Create a histogram plot plt.hist(data, bins=30) # Add labels and title plt.xlabel('Value') plt.ylabel('Frequency') plt.title('Histogram') # Display the plot plt.show()PYTHON
Benefits of Using Matplotlib
- Ease of Use: Matplotlib provides a simple and intuitive interface for creating data exploration visualizations, making it accessible to users of all skill levels, from beginners to experienced data scientists.
- Flexibility: Matplotlib offers a wide range of customization options and plot types, allowing users to create highly customized and tailored visualizations to meet their specific needs.
- Integration: Matplotlib integrates seamlessly with other Python libraries and frameworks, including NumPy, Pandas, SciPy, and scikit-learn, facilitating a streamlined workflow for data analysis and visualization.
- Community and Documentation: Matplotlib benefits from a large and active community of users and contributors who provide extensive documentation, tutorials, and examples to support users in learning and using the library effectively.
- Versatility: Matplotlib can be used for various purposes, including exploratory data analysis, statistical visualization, scientific plotting, and presentation graphics, making it a versatile tool for data visualization in Python.
Introducing IronPDF
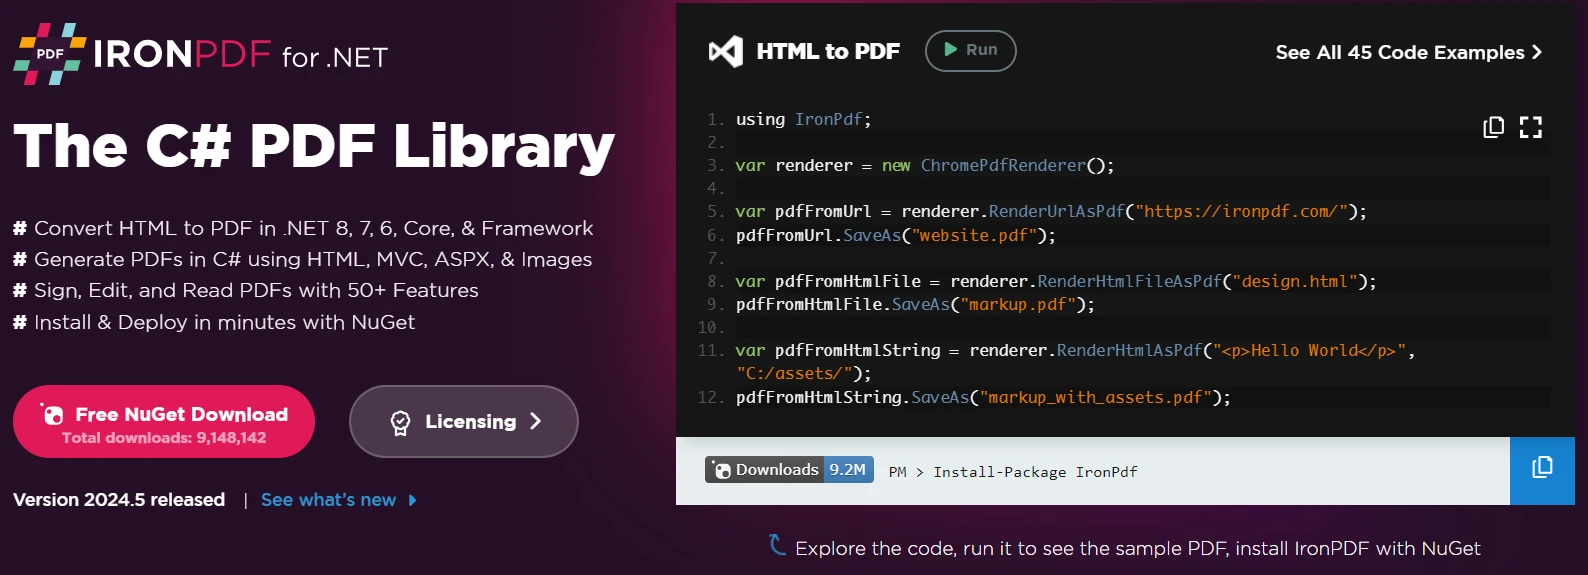
IronPDF is a powerful C# library designed for creating, editing, and signing PDFs from HTML, CSS, images, and JavaScript. It offers commercial-grade performance with a low memory footprint. Key features include:
HTML to PDF Conversion: Convert HTML files, HTML strings, and URLs to PDFs. For example, render a webpage as a PDF using the Chrome PDF renderer.
Cross-Platform Support: Compatible with various .NET platforms, including .NET Core, .NET Standard, and .NET Framework. It supports Windows, Linux, and macOS.
Editing and Signing: Set properties, add security with passwords and permissions, and apply digital signatures to your PDFs.
Page Templates and Settings: Customize PDFs with headers, footers, page numbers, and adjustable margins. Supports responsive layouts and custom paper sizes.
Standards Compliance: Adheres to PDF standards such as PDF/A and PDF/UA. Supports UTF-8 character encoding and handles assets like images, CSS, and fonts.
Generate PDF Documents Using IronPDF
# Import necessary libraries
from ironpdf import *
import matplotlib.pyplot as plt
import numpy as np

# Create a histogram plot
data = np.random.randn(1000)
plt.hist(data, bins=30)
plt.xlabel('Value')
plt.ylabel('Frequency')
plt.title('Histogram')
plt.savefig('myHistogram.png')  # Save the plot as an image file

# Apply your license key
License.LicenseKey = "MyKey"

# Create a PDF renderer
renderer = ChromePdfRenderer()

# Create a PDF from an HTML string containing the histogram image
content = "<h1>Awesome Iron PDF with Matplotlib</h1>"
content += "<img src='myHistogram.png'/>"
pdf = renderer.RenderHtmlAsPdf(content)

# Export the PDF to a file
pdf.SaveAs("awesome.pdf")
# Import necessary libraries
from ironpdf import *
import matplotlib.pyplot as plt
import numpy as np
# Create a histogram plot
data = np.random.randn(1000)
plt.hist(data, bins=30)
plt.xlabel('Value')
plt.ylabel('Frequency')
plt.title('Histogram')
plt.savefig('myHistogram.png') # Save the plot as an image file
# Apply your license key
License.LicenseKey = "MyKey"
# Create a PDF renderer
renderer = ChromePdfRenderer()
# Create a PDF from an HTML string containing the histogram image
content = "<h1>Awesome Iron PDF with Matplotlib</h1>"
content += "<img src='myHistogram.png'/>"
pdf = renderer.RenderHtmlAsPdf(content)
# Export the PDF to a file
pdf.SaveAs("awesome.pdf")Code Explanation
- Create Histogram Plot: As per the previous example, we generate random data and plot a histogram.
- Save Plot as an Image: The histogram plot is saved as an image file named
'myHistogram.png'. - Create PDF Renderer: We initialize a
ChromePdfRendererto handle PDF creation. - Convert HTML String to PDF: Create HTML content embedding the saved image, then convert it to a PDF using
RenderHtmlAsPdf. - Save PDF: The resulting PDF is saved with the
SaveAsmethod.
Output

IronPDF License
# Apply your license key
License.LicenseKey = "IRONPDF-MYLICENSE-KEY-XXXX"
# Apply your license key
License.LicenseKey = "IRONPDF-MYLICENSE-KEY-XXXX"Conclusion
In conclusion, Matplotlib remains a powerful and versatile plotting library that empowers users to create a wide range of high-quality visualizations in Python. Whether you're analyzing data, communicating insights, or building interactive applications, Matplotlib provides the tools and flexibility you need to visualize your data effectively and unlock new insights. Together with the IronPDF library from Iron Software to manage PDF documents, developers can reinforce their knowledge in creating complex data visualizations to help effectively transmit data to meaningful statistics between developers and users, aligning with the goals of modern applications.