Livecharts C# (How It Works For Developers)
LiveCharts is a library for .NET developers. LiveCharts helps create dynamic and beautiful charts in C# applications. This means your charts refresh automatically when your data changes. LiveCharts is not just for traditional applications; it supports the Windows Presentation Foundation (WPF), making it a versatile tool for desktop applications.
Key Features and Benefits
Looking for an answer to your data visualization needs? LiveCharts offers a comprehensive solution with a wide range of features. Here are some key points:
- Automatic Animations: Charts animate automatically, updating smoothly without the need for extra code, making your data visualizations more engaging.
- Support WPF: You can use LiveCharts in WPF applications, allowing for rich user interfaces.
- High Performance: Designed to improve performance, speed, and efficiency, especially with large datasets.
- Flexibility: It's simple, flexible, interactive, and easy to use from the start, but also allows for complex customizations tailored to your project's needs.
- Interactive Charts: Users can interact with the charts, enhancing data exploration.
- Wide Range of Chart Types: Whatever your data visualization needs, LiveCharts has a chart type for it.
LiveCharts turns complex data into interactive, engaging visual representations. Its ease of use and flexibility make it a powerful tool for developers. Using the capabilities of powerful LiveCharts, developers can turn complex data into interactive, engaging visual representations. We'll explore the features of LiveCharts and its integration with the IronPDF library.
Getting Started with LiveCharts
Setting up your development environment to use LiveCharts is straightforward, and accessing its source code enhances customization and understanding. This section guides you through the initial steps and helps you create your first chart.
Setting Up Your Environment
To use LiveCharts, ensure you have Visual Studio installed. Then, add the LiveCharts package, a geared package designed for dynamic data visualization, to your project. You can do this via the NuGet Package Manager. Search for LiveCharts and install the latest version. This process adds all necessary references to your project.
Your First Chart with LiveCharts
Creating your first chart involves a few simple steps. First, add a chart control to your application's UI. If you're using WPF, you can do this in XAML or programmatically in C#.
Here's a basic example in XAML:
<lvc:CartesianChart Series="{Binding MySeries}"/><lvc:CartesianChart Series="{Binding MySeries}"/>In your C# code, prepare the data for your chart. For a basic line chart, you'll need a SeriesCollection. You can populate this collection with LineSeries, setting the Values to your data points.
public SeriesCollection MySeries { get; set; }

public MainWindow()
{
    InitializeComponent();
    // Initialize the series collection and bind data
    MySeries = new SeriesCollection
    {
        new LineSeries
        {
            Values = new ChartValues<double> { 4, 6, 5, 2, 7 }
        }
    };
    // Bind the data context to this instance
    DataContext = this;
}
public SeriesCollection MySeries { get; set; }
public MainWindow()
{
InitializeComponent();
// Initialize the series collection and bind data
MySeries = new SeriesCollection
{
new LineSeries
{
Values = new ChartValues<double> { 4, 6, 5, 2, 7 }
}
};
// Bind the data context to this instance
DataContext = this;
}Public Property MySeries() As SeriesCollection
'INSTANT VB WARNING: The following constructor is declared outside of its associated class:
'ORIGINAL LINE: public MainWindow()
Public Sub New()
InitializeComponent()
' Initialize the series collection and bind data
MySeries = New SeriesCollection
From {
New LineSeries With {
.Values = New ChartValues(Of Double) From {4, 6, 5, 2, 7}
}
}
' Bind the data context to this instance
DataContext = Me
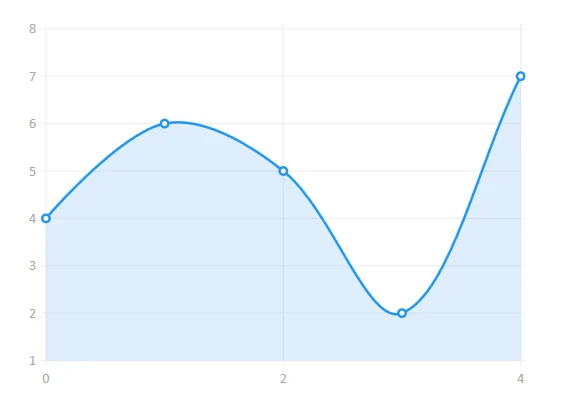
End SubThis code snippet creates a simple line chart. It displays a series of values on a Cartesian chart. Remember to set the DataContext of your window or control to ensure the chart binds to your data.
By following these steps, you'll have a basic chart up and running. This is just the beginning. LiveCharts allows for much more complex and interactive data visualizations.
Exploring LiveCharts Features
LiveCharts is not just about displaying static data. Its real power lies in its ability to update in real-time, react to data changes, and offer a wide range of chart types. This section delves into these capabilities, providing examples to help you grasp the concepts.
Understanding Data Binding and Updates
Data binding is a core concept in LiveCharts. It allows your charts to reflect changes in your data automatically. This feature is especially useful for applications that deal with dynamic data sources.
Consider an application tracking stock prices. As new data comes in, you want your chart to update. With LiveCharts, you just update the data source, and the chart detects these changes and updates accordingly.
Here’s how you can bind a chart to a data source:
var myValues = new ChartValues<double> { 3, 4, 6, 3, 2 };
var lineSeries = new LineSeries
{
    Values = myValues
};

// Add the line series to the series collection
mySeries.Add(lineSeries);

// When data changes
myValues.Add(5); // The chart updates automatically
var myValues = new ChartValues<double> { 3, 4, 6, 3, 2 };
var lineSeries = new LineSeries
{
Values = myValues
};
// Add the line series to the series collection
mySeries.Add(lineSeries);
// When data changes
myValues.Add(5); // The chart updates automaticallyDim myValues = New ChartValues(Of Double) From {3, 4, 6, 3, 2}
Dim lineSeries As New LineSeries With {.Values = myValues}
' Add the line series to the series collection
mySeries.Add(lineSeries)
' When data changes
myValues.Add(5) ' The chart updates automatically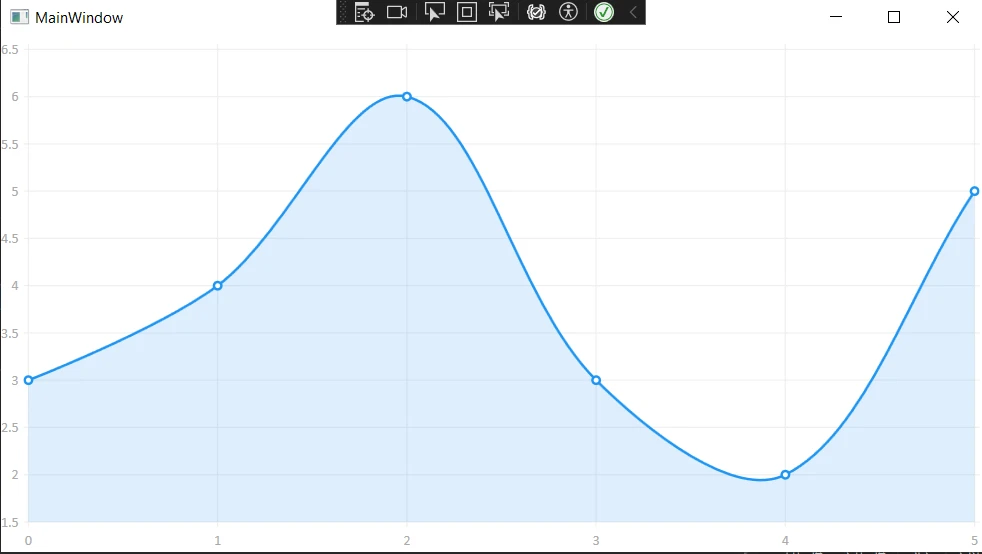
Diving into Chart Types
LiveCharts supports various chart types, each suited for different kinds of data visualization needs. Here are a few examples:
- Line Series: Ideal for displaying trends over time.
- Pie Chart: Best for showing proportions in a dataset.
- Bar Chart: Useful for comparing quantities among different categories.
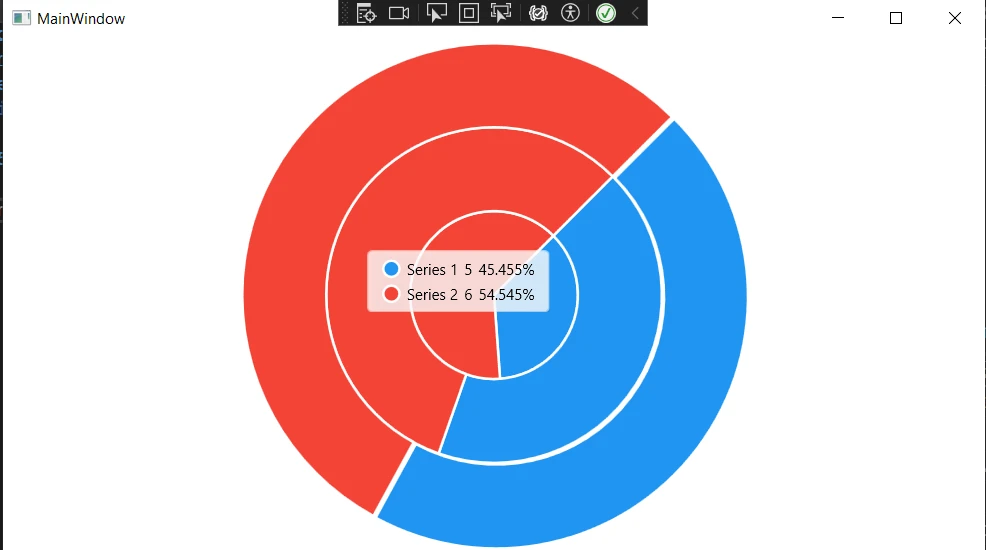
To create a pie chart, you would use the PieSeries class. Here's a quick example:
public SeriesCollection MyPieSeries { get; set; }

public MainWindow()
{
    InitializeComponent();
    // Initialize the pie series collection and bind data
    MyPieSeries = new SeriesCollection
    {
        new PieSeries
        {
            Values = new ChartValues<double> { 4, 6, 5 },
            Title = "Series 1"
        },
        new PieSeries
        {
            Values = new ChartValues<double> { 7, 8, 6 },
            Title = "Series 2"
        }
    };
    // Bind the data context to this instance
    DataContext = this;
}
public SeriesCollection MyPieSeries { get; set; }
public MainWindow()
{
InitializeComponent();
// Initialize the pie series collection and bind data
MyPieSeries = new SeriesCollection
{
new PieSeries
{
Values = new ChartValues<double> { 4, 6, 5 },
Title = "Series 1"
},
new PieSeries
{
Values = new ChartValues<double> { 7, 8, 6 },
Title = "Series 2"
}
};
// Bind the data context to this instance
DataContext = this;
}Public Property MyPieSeries() As SeriesCollection
'INSTANT VB WARNING: The following constructor is declared outside of its associated class:
'ORIGINAL LINE: public MainWindow()
Public Sub New()
InitializeComponent()
' Initialize the pie series collection and bind data
MyPieSeries = New SeriesCollection
From {
New PieSeries With {
.Values = New ChartValues(Of Double) From {4, 6, 5},
.Title = "Series 1"
},
New PieSeries With {
.Values = New ChartValues(Of Double) From {7, 8, 6},
.Title = "Series 2"
}
}
' Bind the data context to this instance
DataContext = Me
End SubThis code snippet sets up a basic pie chart with two data series. Like the line chart example, it binds the PieSeries to the Values property.
LiveCharts also offers flexibility and control over the appearance and behavior of your charts. You can customize nearly every aspect, from colors and labels to animations and interactivity. This makes it possible to tailor your charts to fit the look and feel of your application perfectly.
Introduction to IronPDF
Integrating LiveCharts with IronPDF bridges the gap between dynamic data visualization and static report generation. IronPDF is a powerful library for C# that allows developers to create, manipulate, and convert PDF documents programmatically.
Combining it with LiveCharts enables the creation of PDF reports containing your interactive charts. This section introduces IronPDF and guides you on how to set it up in your project.
Why IronPDF?
IronPDF's HTML to PDF Conversion Capabilities excel where other PDF libraries fall short, especially in its ability to render HTML to PDF. This feature is particularly useful when working with LiveCharts, as you can render your charts to HTML canvases and then convert these canvases into PDF documents. IronPDF supports full CSS3, JavaScript, and HTML5, ensuring that your charts look as intended in the PDF output.
LiveCharts with IronPDF
Here's a detailed code example that illustrates the process of creating a chart with LiveCharts, exporting it, and then using IronPDF to generate a PDF report that includes this chart. This example assumes you have a basic understanding of how to work with LiveCharts and IronPDF.
First, ensure you have the LiveCharts and IronPDF packages installed in your project via NuGet.
Step 1: Generate the Chart with LiveCharts
Let's start by creating a simple line chart using LiveCharts. For simplicity, this example will focus on generating the chart and saving it as an image, which will later be included in our PDF.
private void GenerateChartButton_Click(object sender, RoutedEventArgs e)
{
    CreateAndSaveChartImage();
}

public void CreateAndSaveChartImage()
{
    // Create the series collection for the chart
    var seriesCollection = new SeriesCollection
    {
        new LineSeries
        {
            Values = new ChartValues<double> { 4, 6, 5, 2, 7 },
            Title = "Sample Series"
            // You can set other properties like color, point geometry, etc.
        }
    };

    // Initialize the CartesianChart
    var chart = new CartesianChart
    {
        Series = seriesCollection,
        Width = 400,
        Height = 300,
        Background = Brushes.White
    };

    // Add chart to the UI
    ChartContainer.Child = chart;

    // Force the chart to update
    chart.Update(true, true);

    // Save the rendered chart as an image
    SaveChartToImage(chart);
}

private void SaveChartToImage(CartesianChart chart)
{
    // Measure and arrange the chart to ensure correct layout
    chart.Measure(new Size(chart.Width, chart.Height));
    chart.Arrange(new Rect(0, 0, chart.Width, chart.Height));

    // Create a render target bitmap and render the chart on it
    var renderTargetBitmap = new RenderTargetBitmap(
        (int)chart.ActualWidth, (int)chart.ActualHeight,
        96, 96, PixelFormats.Pbgra32);

    renderTargetBitmap.Render(chart);

    // Encode the rendered image to a PNG format
    var encoder = new PngBitmapEncoder();
    encoder.Frames.Add(BitmapFrame.Create(renderTargetBitmap));

    // Define the path where the chart will be saved
    string path = "chart.png";

    // Save the encoded PNG to the file system
    using (var stream = File.Create(path))
    {
        encoder.Save(stream);
    }

    // Inform the user of the successful save
    MessageBox.Show($"Chart saved as {path}");
}
private void GenerateChartButton_Click(object sender, RoutedEventArgs e)
{
CreateAndSaveChartImage();
}
public void CreateAndSaveChartImage()
{
// Create the series collection for the chart
var seriesCollection = new SeriesCollection
{
new LineSeries
{
Values = new ChartValues<double> { 4, 6, 5, 2, 7 },
Title = "Sample Series"
// You can set other properties like color, point geometry, etc.
}
};
// Initialize the CartesianChart
var chart = new CartesianChart
{
Series = seriesCollection,
Width = 400,
Height = 300,
Background = Brushes.White
};
// Add chart to the UI
ChartContainer.Child = chart;
// Force the chart to update
chart.Update(true, true);
// Save the rendered chart as an image
SaveChartToImage(chart);
}
private void SaveChartToImage(CartesianChart chart)
{
// Measure and arrange the chart to ensure correct layout
chart.Measure(new Size(chart.Width, chart.Height));
chart.Arrange(new Rect(0, 0, chart.Width, chart.Height));
// Create a render target bitmap and render the chart on it
var renderTargetBitmap = new RenderTargetBitmap(
(int)chart.ActualWidth, (int)chart.ActualHeight,
96, 96, PixelFormats.Pbgra32);
renderTargetBitmap.Render(chart);
// Encode the rendered image to a PNG format
var encoder = new PngBitmapEncoder();
encoder.Frames.Add(BitmapFrame.Create(renderTargetBitmap));
// Define the path where the chart will be saved
string path = "chart.png";
// Save the encoded PNG to the file system
using (var stream = File.Create(path))
{
encoder.Save(stream);
}
// Inform the user of the successful save
MessageBox.Show($"Chart saved as {path}");
}Imports System
Private Sub GenerateChartButton_Click(ByVal sender As Object, ByVal e As RoutedEventArgs)
CreateAndSaveChartImage()
End Sub
Public Sub CreateAndSaveChartImage()
' Create the series collection for the chart
Dim seriesCollection As New SeriesCollection
From {
New LineSeries With {
.Values = New ChartValues(Of Double) From {4, 6, 5, 2, 7},
.Title = "Sample Series"
}
}
' Initialize the CartesianChart
Dim chart = New CartesianChart With {
.Series = seriesCollection,
.Width = 400,
.Height = 300,
.Background = Brushes.White
}
' Add chart to the UI
ChartContainer.Child = chart
' Force the chart to update
chart.Update(True, True)
' Save the rendered chart as an image
SaveChartToImage(chart)
End Sub
Private Sub SaveChartToImage(ByVal chart As CartesianChart)
' Measure and arrange the chart to ensure correct layout
chart.Measure(New Size(chart.Width, chart.Height))
chart.Arrange(New Rect(0, 0, chart.Width, chart.Height))
' Create a render target bitmap and render the chart on it
Dim renderTargetBitmap As New RenderTargetBitmap(CInt(Math.Truncate(chart.ActualWidth)), CInt(Math.Truncate(chart.ActualHeight)), 96, 96, PixelFormats.Pbgra32)
renderTargetBitmap.Render(chart)
' Encode the rendered image to a PNG format
Dim encoder = New PngBitmapEncoder()
encoder.Frames.Add(BitmapFrame.Create(renderTargetBitmap))
' Define the path where the chart will be saved
Dim path As String = "chart.png"
' Save the encoded PNG to the file system
Using stream = File.Create(path)
encoder.Save(stream)
End Using
' Inform the user of the successful save
MessageBox.Show($"Chart saved as {path}")
End Sub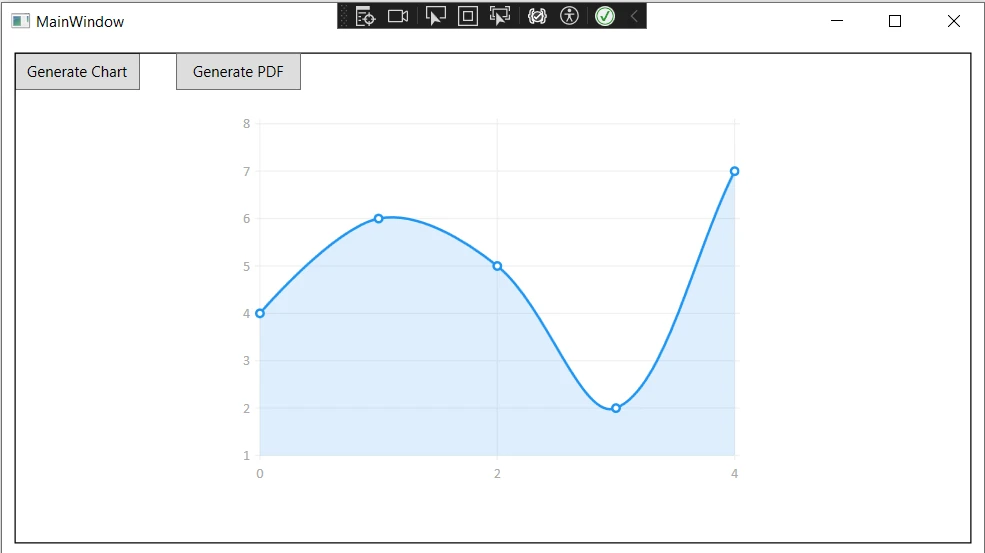
Step 2: Create an HTML Template and Insert the Chart
Now, we'll prepare our HTML content, embedding the chart we just saved as an image.
string htmlContent = @"
<html>
<body>
<h1>Chart Report</h1>
<img src='chart.png' alt='Chart'>
<p>This is a report generated by combining LiveCharts and IronPDF.</p>
</body>
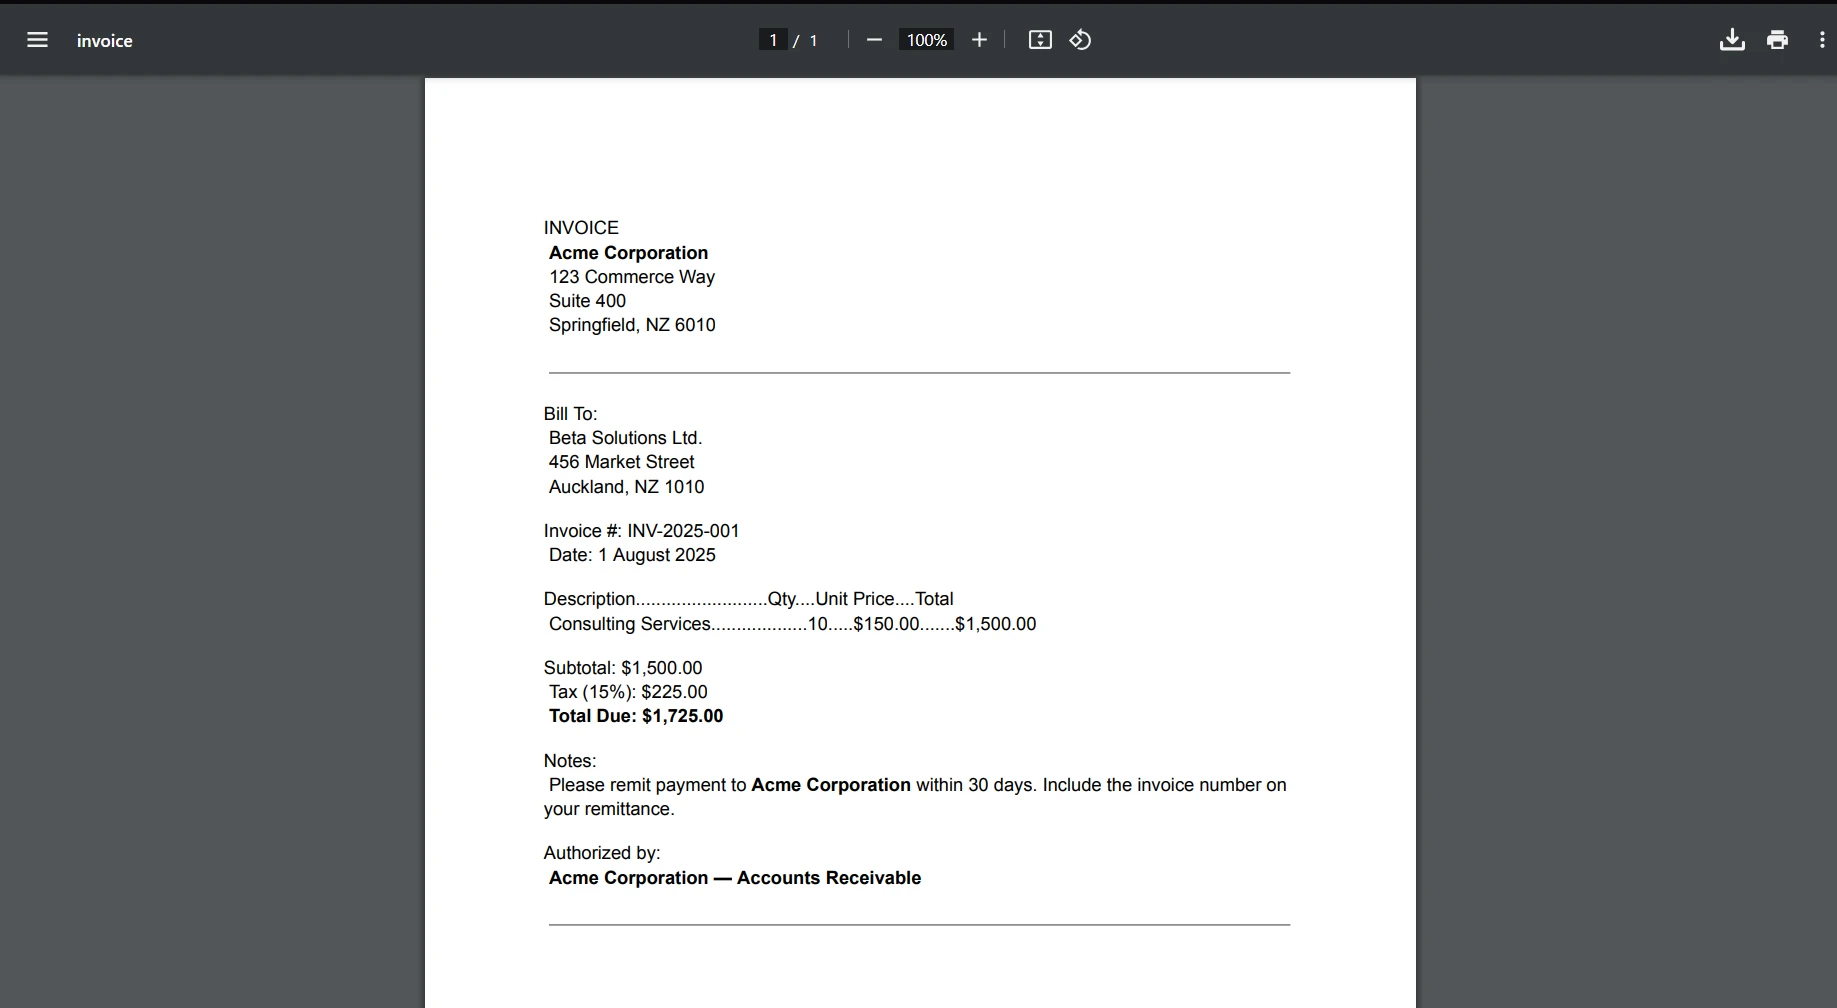
</html>";Step 3: Convert HTML to PDF with IronPDF
Finally, we'll use IronPDF to convert our HTML content, including the embedded chart image, into a PDF document.
using IronPdf;

public void CreatePdfReport(string htmlContent)
{
    // Initialize the HTML to PDF converter
    var renderer = new ChromePdfRenderer();

    // Render the HTML content as a PDF
    var pdf = renderer.RenderHtmlAsPdf(htmlContent);

    // Save the rendered PDF to the file system
    pdf.SaveAs("Report.pdf");
}
using IronPdf;
public void CreatePdfReport(string htmlContent)
{
// Initialize the HTML to PDF converter
var renderer = new ChromePdfRenderer();
// Render the HTML content as a PDF
var pdf = renderer.RenderHtmlAsPdf(htmlContent);
// Save the rendered PDF to the file system
pdf.SaveAs("Report.pdf");
}Imports IronPdf
Public Sub CreatePdfReport(ByVal htmlContent As String)
' Initialize the HTML to PDF converter
Dim renderer = New ChromePdfRenderer()
' Render the HTML content as a PDF
Dim pdf = renderer.RenderHtmlAsPdf(htmlContent)
' Save the rendered PDF to the file system
pdf.SaveAs("Report.pdf")
End SubMake sure to replace "chart.png" in the htmlContent string with the correct path to your chart image if it's not in the same directory as your application's executable.
This example covers a basic scenario to illustrate the process. Depending on your specific requirements, you might need to adjust the code, especially regarding how you handle and source images for your charts.
Advanced Techniques and Tips
To further enhance the integration:
- Optimize Performance: For large datasets or complex charts, consider optimizing the performance of both LiveCharts and IronPDF to ensure quick loading times and smooth operation.
- Interactive PDFs: Although PDFs are static, adding hyperlinks or bookmarks can improve navigation, making the reports more user-friendly.
- Custom Styling: Use CSS within your HTML templates to ensure that the reports match your corporate branding or design guidelines.
Conclusion
In conclusion, integrating LiveCharts with IronPDF offers a powerful combination for .NET developers looking to create dynamic, visually appealing charts and incorporate them into professionally styled PDF reports. This synergy not only enhances the presentation of data but also expands the utility of applications by facilitating the generation of static reports from dynamic datasets.
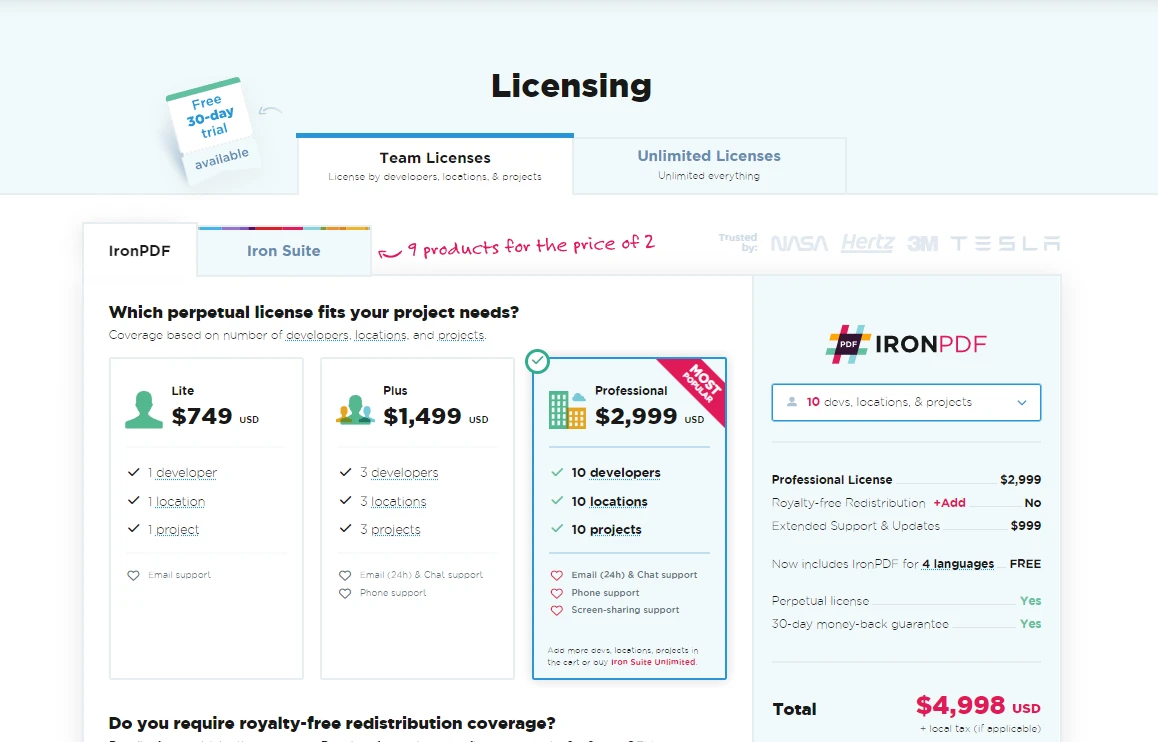
IronPDF's capability to render HTML to PDF, complete with full support for CSS3, JavaScript, and HTML5, ensures that your charts transition seamlessly from the screen to the printed page. For those interested in exploring this functionality, IronPDF offers a free trial of IronPDF starting at $999, providing a cost-effective solution for high-quality report generation in .NET applications.
Frequently Asked Questions
How can I integrate LiveCharts with a PDF library in C#?
To integrate LiveCharts with a PDF library, you can render your charts as images, incorporate them into an HTML document, and then use IronPDF to convert this HTML document into a PDF. This allows you to include dynamic chart visuals in your PDF reports.
Can I convert HTML charts to PDF in C#?
Yes, you can convert HTML charts to PDF using IronPDF. IronPDF can take HTML content that includes chart renderings and convert it into a PDF document, preserving the interactive and visual elements of the charts.
What are the benefits of using LiveCharts for C# applications?
LiveCharts offers several benefits, including automatic animations, support for real-time data updates, high performance with large datasets, and a wide variety of chart types. It is also compatible with WPF, which enhances the development of desktop applications.
How do I ensure my charts in C# applications update automatically?
LiveCharts supports data binding, which allows charts to automatically update when the underlying data changes. This feature is particularly useful for applications that require real-time data visualization, such as stock price tracking.
What features make a PDF library suitable for chart integration?
A suitable PDF library for chart integration, like IronPDF, should support HTML to PDF conversion, allow for CSS3 and JavaScript styling, and maintain the visual integrity of charts when they are rendered into PDF format. It should also provide options for embedding images and other interactive elements.
How can I create interactive PDF reports using C#?
You can create interactive PDF reports in C# by using IronPDF to convert HTML content, which includes JavaScript-driven interactive elements and charts, into PDF format. This approach maintains interactivity and visual appeal in the resulting PDF.
What is the process for setting up LiveCharts in a .NET project?
To set up LiveCharts in a .NET project, you need to install the LiveCharts package via NuGet in Visual Studio. After installation, you can add chart controls to your application's UI and bind data to these controls using C# code.
How can I optimize the performance of charts and PDFs in C# applications?
To optimize performance, minimize the dataset size for rendering, leverage hardware acceleration for animations in charts, and use asynchronous processing. For PDFs, optimize the HTML content before conversion and use compression features available in IronPDF.
What types of charts can LiveCharts produce?
LiveCharts can produce a variety of chart types, including line, pie, bar, and more complex series. This versatility allows developers to choose the most appropriate chart type for their specific data visualization needs.
Is it possible to try out a PDF library for free?
Yes, IronPDF offers a free trial that allows developers to evaluate its capabilities for generating high-quality PDF documents from HTML content, including charts and other visual elements.