NPlot C# (How It Works For Developers)
This tutorial is designed for beginners who are keen to explore the integration of two powerful libraries: NPlot and IronPDF. Together, they form a robust toolkit for creating and exporting charts in C# applications.
NPlot is a versatile charting library in the .NET framework, ideal for generating a wide range of graphs and plots. From simple line plots to complex scatter charts, NPlot excels in displaying sample-based data and generating dynamic charts, whether you're working with small datasets or very large datasets.
IronPDF complements NPlot by enabling the conversion of these charts into PDF documents. Whether you're dealing with HTML email content or specific plot classes, IronPDF can render them into high-quality PDFs.
This functionality is particularly useful for applications that require report generation or documentation of analyzed data.
Getting Started with NPlot
Introduction to NPlot in the .NET Framework
NPlot is a dynamic charting library designed for the .NET Framework, catering to a broad range of data visualization needs. Whether you're working on desktop applications or web-based solutions, NPlot offers the functionality to represent data graphically, clearly, and effectively.
Installing NPlot in Your C# Project
To begin using NPlot in your C# project, you need to install it. Here's how you can easily add NPlot to your application:
Using NuGet Package Manager:
- In Visual Studio, go to 'Tools' > 'NuGet Package Manager' > 'Manage NuGet Packages for Solution...'.
- Search for 'NPlot' and install it in your project.
First Steps with NPlot
Once NPlot is installed, you can start creating charts. NPlot's ease of use makes it ideal for beginners, allowing for the creation of plots with just a few lines of code.
Creating a Basic Chart
Let's create a simple line plot as our first chart:
Setting Up the Plot Surface: Create a PlotSurface2D object. This acts as the canvas for your plot. Set a few display properties to customize its appearance, such as the background color and title.
Adding Data to the Plot: Use NPlot's LinePlot class to create a line plot. Add data values belonging to one or more categories. These data points will be plotted on the graph.
Displaying the Chart: Add the line plot to the plot surface. Render the plot surface in a form or a user control for display.
using System;
using NPlot;

class Program
{
    static void Main()
    {
        // Create a new bitmap plot surface
        var plotSurface = new NPlot.Bitmap.PlotSurface2D(800, 600);

        // Create a line plot
        var linePlot = new LinePlot
        {
            AbscissaData = new double[] { 1, 2, 3, 4, 5 },
            OrdinateData = new double[] { 1, 4, 9, 16, 25 }
        };

        // Add the line plot to the plot surface
        plotSurface.Add(linePlot);

        // Customize the plot (e.g., titles, labels)
        plotSurface.Title = "Sample Plot";
        plotSurface.XAxis1.Label = "X-Axis";
        plotSurface.YAxis1.Label = "Y-Axis";

        // Refresh the plot to render it
        plotSurface.Refresh();

        // Save the plot as a PNG image
        plotSurface.Bitmap.Save("c://plot.png", System.Drawing.Imaging.ImageFormat.Png);

        Console.WriteLine("Plot saved as plot.png");
    }
}
using System;
using NPlot;
class Program
{
static void Main()
{
// Create a new bitmap plot surface
var plotSurface = new NPlot.Bitmap.PlotSurface2D(800, 600);
// Create a line plot
var linePlot = new LinePlot
{
AbscissaData = new double[] { 1, 2, 3, 4, 5 },
OrdinateData = new double[] { 1, 4, 9, 16, 25 }
};
// Add the line plot to the plot surface
plotSurface.Add(linePlot);
// Customize the plot (e.g., titles, labels)
plotSurface.Title = "Sample Plot";
plotSurface.XAxis1.Label = "X-Axis";
plotSurface.YAxis1.Label = "Y-Axis";
// Refresh the plot to render it
plotSurface.Refresh();
// Save the plot as a PNG image
plotSurface.Bitmap.Save("c://plot.png", System.Drawing.Imaging.ImageFormat.Png);
Console.WriteLine("Plot saved as plot.png");
}
}Imports System
Imports NPlot
Friend Class Program
Shared Sub Main()
' Create a new bitmap plot surface
Dim plotSurface = New NPlot.Bitmap.PlotSurface2D(800, 600)
' Create a line plot
Dim linePlot As New LinePlot With {
.AbscissaData = New Double() { 1, 2, 3, 4, 5 },
.OrdinateData = New Double() { 1, 4, 9, 16, 25 }
}
' Add the line plot to the plot surface
plotSurface.Add(linePlot)
' Customize the plot (e.g., titles, labels)
plotSurface.Title = "Sample Plot"
plotSurface.XAxis1.Label = "X-Axis"
plotSurface.YAxis1.Label = "Y-Axis"
' Refresh the plot to render it
plotSurface.Refresh()
' Save the plot as a PNG image
plotSurface.Bitmap.Save("c://plot.png", System.Drawing.Imaging.ImageFormat.Png)
Console.WriteLine("Plot saved as plot.png")
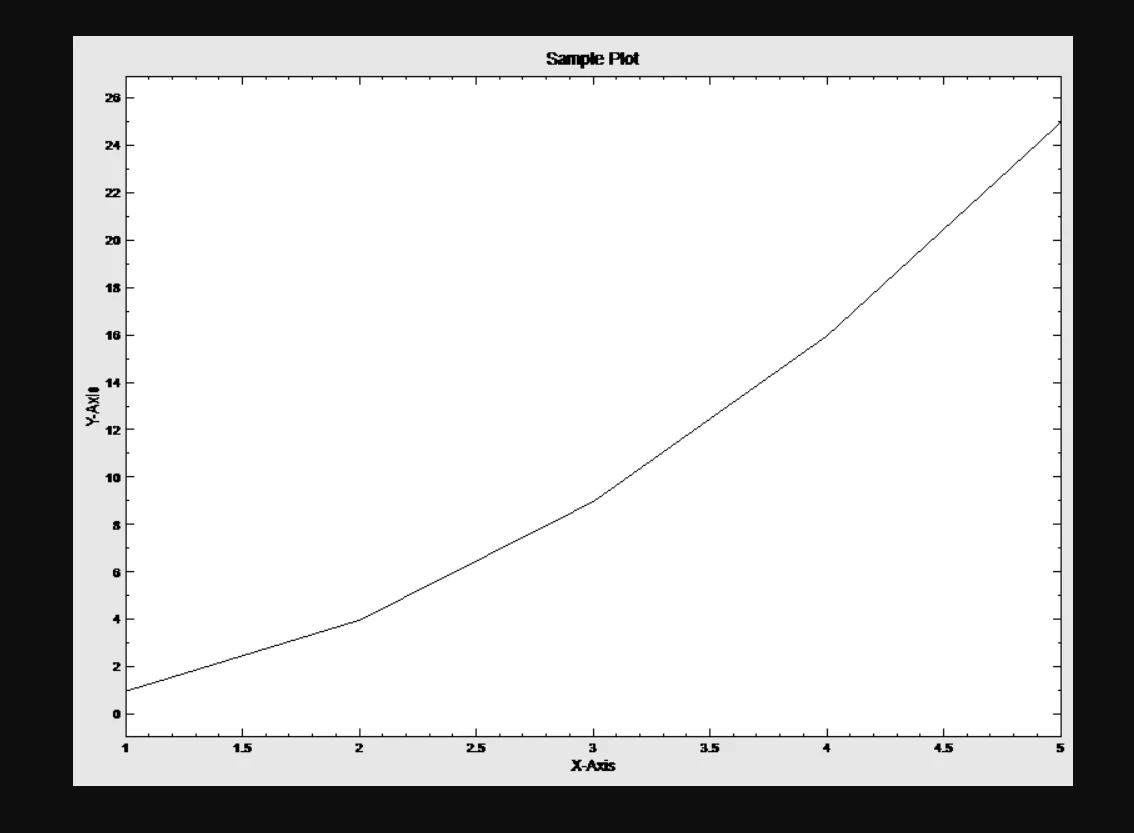
End Sub
End ClassHere is the output plot image:
Advanced Charting Techniques with NPlot
After mastering basic plots, NPlot offers a range of more complex chart types to enhance your data visualization capabilities. These include bar plots, scatter charts, and step plots, each suited for different kinds of data representation.
Utilizing Bar and Scatter Plots
Bar Plot: Ideal for displaying data values in one or more categories. Each bar represents a data value, with its height indicating the value's magnitude.
Scatter Plot: Perfect for visualizing data sets where each data point is independent. It plots data points on a two-dimensional graph, allowing for the analysis of patterns or trends.
Implementing a Step Plot
Step Plot: Used for data that involves successive abscissa values, such as time-series data. It creates a staircase-like representation, clearly showing changes between successive data points.
Integrating NPlot with IronPDF
The integration of NPlot with IronPDF allows for the seamless conversion of charts into PDF documents. IronPDF is a powerful library that enables the rendering of HTML content and plot classes into high-quality PDF files. This integration is particularly useful for applications that require generating reports or documenting analyzed data.
Get Started with IronPDF
Install IronPDF Library
Install Using NuGet Package Manager
To integrate IronPDF into your NPlot C# project using the NuGet Package manager, follow these steps:
- Open Visual Studio and in the solution explorer, right-click on your project.
- Choose “Manage NuGet packages…” from the context menu.
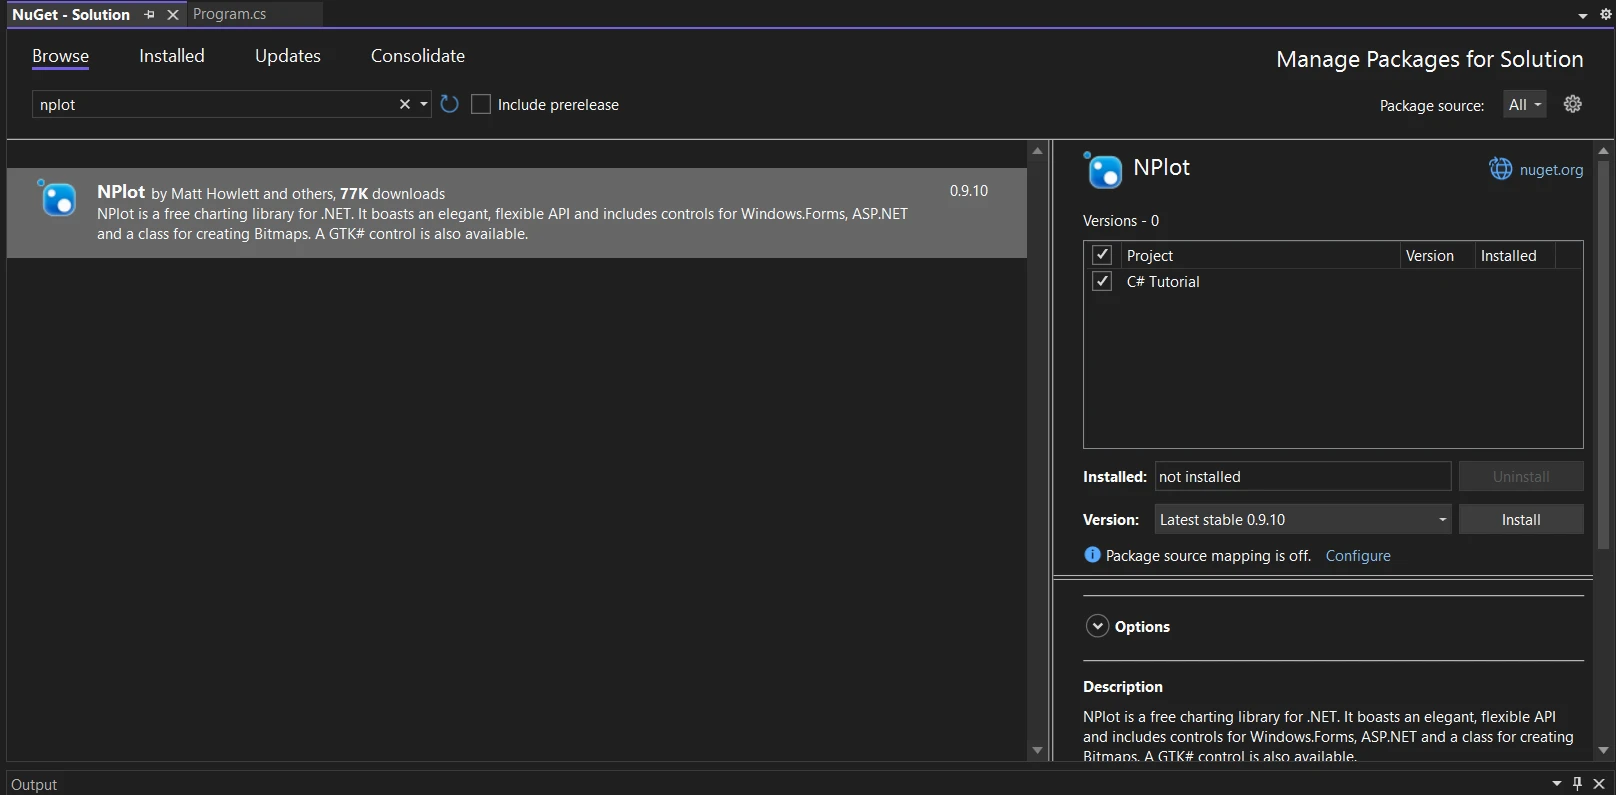
- Go to the browse tab and search IronPDF.
- Select the IronPDF library from the search results and click install button.
- Accept any license agreement prompt.
If you want to include IronPDF in your project via Package manager console, then execute the following command in Package Manager Console:
Install-Package IronPdf
It’ll fetch and install IronPDF into your project.
Install Using NuGet Website
For a detailed overview of IronPDF, including its features, compatibility, and additional download options, visit the IronPDF page on the NuGet website at https://www.nuget.org/packages/IronPdf.
Install Via DLL
Alternatively, you can incorporate IronPDF directly into your project using its dll file. Download the ZIP file containing the DLL from the IronPDF Download Page. Unzip it, and include the DLL in your project.
Generating Dynamic Charts with NPlot
NPlot excels in creating dynamic and visually appealing charts within C# applications. This section will guide you through generating a scatter chart, a typical use case for displaying data with two variables.
Scatter charts are particularly effective in visualizing the relationship between the variables. Follow these steps to create a scatter plot:
- Initiate Plot Surface: Start by creating a
PlotSurface2Dinstance. - Prepare Data: Gather the data values you wish to plot. Scatter charts plot individual points, so you'll need two arrays of values: one for the x-coordinates and another for the y-coordinates. You can add as many plots as you want to the
PlotSurface2D. - Instantiate a Scatter Plot: Use NPlot's
PointPlotorScatterPlotclass to create your chart with your plot objects. - Customize the Chart: Apply various customizations like setting the point styles, colors, and axes properties to make the chart informative and appealing.
using NPlot;

class Program
{
    static void Main()
    {
        var plotSurface = new NPlot.Windows.PlotSurface2D();

        // Prepare data for the scatter plot
        var scatterPlot = new PointPlot
        {
            AbscissaData = new double[] { /* x-coordinates */ },
            OrdinateData = new double[] { /* y-coordinates */ }
        };

        // Add the scatter plot to the plot surface
        plotSurface.Add(scatterPlot);

        // Customize the chart and render the plotSurface
        plotSurface.Refresh();
    }
}
using NPlot;
class Program
{
static void Main()
{
var plotSurface = new NPlot.Windows.PlotSurface2D();
// Prepare data for the scatter plot
var scatterPlot = new PointPlot
{
AbscissaData = new double[] { /* x-coordinates */ },
OrdinateData = new double[] { /* y-coordinates */ }
};
// Add the scatter plot to the plot surface
plotSurface.Add(scatterPlot);
// Customize the chart and render the plotSurface
plotSurface.Refresh();
}
}Imports NPlot
Friend Class Program
Shared Sub Main()
Dim plotSurface = New NPlot.Windows.PlotSurface2D()
' Prepare data for the scatter plot
Dim scatterPlot = New PointPlot With {
.AbscissaData = New Double() { },
.OrdinateData = New Double() { }
}
' Add the scatter plot to the plot surface
plotSurface.Add(scatterPlot)
' Customize the chart and render the plotSurface
plotSurface.Refresh()
End Sub
End ClassConverting Charts to PDF with IronPDF
Once you have created a chart with NPlot, you can use IronPDF to convert this chart into a PDF document. This process involves rendering the chart as an image and then using IronPDF to embed this image in a PDF. You can follow these steps to convert charts to PDF:
- Render Chart as Image: First, convert your NPlot chart into an image format. This can be done by drawing the
PlotSurface2Donto a bitmap. - Create PDF with IronPDF: Use IronPDF's API to create a new PDF document and insert the chart image.
using IronPdf;

class Program
{
    static void Main()
    {
        // Assuming 'chartImagePath' is the path to the Bitmap image of your NPlot chart
        var imageFiles = new string[] { "chartImagePath" };

        // Convert image files to PDF and save the output
        ImageToPdfConverter.ImageToPdf(imageFiles).SaveAs("Chart.pdf");
    }
}
using IronPdf;
class Program
{
static void Main()
{
// Assuming 'chartImagePath' is the path to the Bitmap image of your NPlot chart
var imageFiles = new string[] { "chartImagePath" };
// Convert image files to PDF and save the output
ImageToPdfConverter.ImageToPdf(imageFiles).SaveAs("Chart.pdf");
}
}Imports IronPdf
Friend Class Program
Shared Sub Main()
' Assuming 'chartImagePath' is the path to the Bitmap image of your NPlot chart
Dim imageFiles = New String() { "chartImagePath" }
' Convert image files to PDF and save the output
ImageToPdfConverter.ImageToPdf(imageFiles).SaveAs("Chart.pdf")
End Sub
End ClassConclusion
Throughout this tutorial, we've explored the integration of two powerful libraries in C#: NPlot for creating dynamic, data-driven charts from data-dependent elements, and IronPDF for converting these charts into PDF documents.
This combination provides a comprehensive toolkit for C# developers, allowing them to visualize data effectively and then seamlessly transition that data into a shareable, archival format.
Start with IronPDF's Free Trial License, available from $999.
Frequently Asked Questions
What is NPlot and how is it used in C#?
NPlot is a versatile charting library in the .NET framework used for generating a variety of graphs and plots in C#. It is ideal for visualizing both small and large datasets with simple line plots to complex scatter charts.
How do I install NPlot in a C# project?
You can install NPlot in your C# project using the NuGet Package Manager in Visual Studio. Go to 'Tools' > 'NuGet Package Manager' > 'Manage NuGet Packages for Solution...', search for 'NPlot', and proceed with the installation.
How can I create a chart using NPlot in C#?
To create a chart with NPlot, initialize a PlotSurface2D object, create a LinePlot with your data, and add it to the plot surface. Customize it with titles, labels, and then render the chart.
What are some advanced charting techniques available in NPlot?
NPlot provides advanced charting techniques like bar plots, scatter charts, and step plots, allowing you to effectively represent your data in various visualization formats.
How can IronPDF be used with NPlot charts?
IronPDF can convert charts created with NPlot into high-quality PDF documents, making it useful for generating reports or documenting data analysis in a shareable format.
How do I add IronPDF to my C# project?
To add IronPDF to your project, use the NuGet Package Manager in Visual Studio to install IronPDF, or download the DLL from the IronPDF website and include it in your project manually.
How can I convert NPlot charts to PDF using IronPDF?
First, render your NPlot chart as an image. Then, use IronPDF's API to create a PDF document and insert the chart image. This process allows you to easily convert image files to PDF format.
What are the advantages of using NPlot and IronPDF together?
Using NPlot with IronPDF allows developers to create detailed, dynamic charts and then convert them into PDFs for reporting and documentation, effectively combining data visualization with archival capabilities.
Is there a trial version of IronPDF available for developers?
Yes, a free trial license of IronPDF is available, enabling developers to explore its features and capabilities before committing to a full license.