Dottrace .NET Core(開発者向けの動作方法)
パフォーマンス プロファイリングに不可欠なツールとして機能する、 .NETエコシステムの強力なツールである Dottrace .NET Core を紹介します。 .NETトレース ツールはパフォーマンス プロファイラーとして、実行中のプロセスの実行時イベントに関する洞察を提供する詳細なトレース ファイルをキャプチャできます。 このツールは、.NET フレームワーク上に構築されたアプリケーションを最適化するために不可欠です。
ユニットテストを実施しているか、継続的インテグレーションビルドを統合しているかにかかわらず、Dottraceを使用するとアプリケーションのパフォーマンスを効果的に監視および分析できます。 このツールを利用することで、アプリケーションの動作をより深く理解し、最高のパフォーマンスと信頼性を確保できます。
IronPDF は、.NET アプリケーションで PDF を操作するための包括的なライブラリです。 これにより、PDFファイルを作成、編集、および内容を抽出できます。 IronPDFはHTMLからPDFへの変換、PDFのマージや分割といった機能をサポートしています。 このライブラリは、PDFドキュメントを生成または操作する必要があるあらゆるアプリケーションにとって貴重なツールです。 この記事では、Dottraceと連携してこのライブラリを使用し、DottraceとIronPDFの有効性の実際のユースケースを示します。
Dottrace .NET Coreの使い始め
.NETプロジェクトにDottrace .NET Coreをセットアップする
まず、NuGetを使ってDottrace .NET Coreをインストールする必要があります。 Visual Studioを開いて、次の手順に従ってください。
- Visual Studioを開きます。
- 新しいプロジェクトを作成を選択します。
- コンソールアプリ(.NET Core)を選択し、次へをクリックします。
- プロジェクトに
DottraceExampleという名前を付けて、 [作成] をクリックします。 - ソリューションエクスプローラーでプロジェクトを右クリックし、NuGetパッケージの管理を選択します。
- NuGetパッケージ マネージャーで、
JetBrains.dotTrace.CommandLineToolsを検索します。 - パッケージを選択し、インストールをクリックします。
これにより、Dottraceがプロジェクトの依存関係としてインストールされます。

簡単なコンソールアプリケーションのプロファイリング
プロファイリング用の基本的なコンソールアプリケーションを作成しましょう。Program.cs のコードを以下のコードに置き換えてください。
using System;
using System.Threading;

class Program
{
    static void Main(string[] args)
    {
        Console.WriteLine("Starting application...");
        // Simulating a time-consuming operation
        Thread.Sleep(5000);
        Console.WriteLine("Application finished.");
    }
}
using System;
using System.Threading;
class Program
{
static void Main(string[] args)
{
Console.WriteLine("Starting application...");
// Simulating a time-consuming operation
Thread.Sleep(5000);
Console.WriteLine("Application finished.");
}
}Imports System
Imports System.Threading
Friend Class Program
Shared Sub Main(ByVal args() As String)
Console.WriteLine("Starting application...")
' Simulating a time-consuming operation
Thread.Sleep(5000)
Console.WriteLine("Application finished.")
End Sub
End ClassF5を押してアプリケーションをビルドして実行します。 アプリケーションが実行中の場合、プロファイリングのためにプロセスIDが必要です。 Visual Studioの診断ツールウィンドウを使うか、タスクマネージャーでプロセスIDを確認できます。
Dottraceを使ってアプリケーションをプロファイリングするには、ターミナルウィンドウかVisual Studioのパッケージマネージャーコンソールを開き、次を実行します。
dotnet trace collect --process-id <your-process-id> --output trace.nettracedotnet trace collect --process-id <your-process-id> --output trace.nettrace<your-process-id> を実行中のアプリケーションの実際のプロセス ID に置き換えます。
アプリケーションが終了すると、trace.nettrace ファイルが作成されます。このファイルには、アプリケーションの実行中に収集されたすべてのプロファイリングデータが含まれています。 このファイルはVisual Studioで分析できます。 次の手順に従います。
- Visual Studioを開きます。
- ファイル > 開く > ファイルに移動します。
trace.nettraceファイルを選択し、 [開く]をクリックします。
Visual Studioは詳細なパフォーマンスデータを表示し、パフォーマンスのボトルネックを特定して修正することができます。
これでDottraceを設定し、基本的なプロファイリング例を作成したので、さらに高度な機能の実装に進むことができます。
Dottrace .NET Coreの機能を実装する
CPU使用率の分析
Dottrace .NET Coreの主要な機能の一つは、CPU使用率の分析です。 これは、コードのどの部分が最も多くのCPUリソースを消費しているかを特定するのに役立ちます。 次のように操作を行います。
まず、Visual Studioでアプリケーションを起動します。 次に、ターミナルまたはパッケージマネージャーコンソールで次を実行します。
dotnet trace collect --process-id <your-process-id> --output cpu_usage.nettracedotnet trace collect --process-id <your-process-id> --output cpu_usage.nettrace<your-process-id> をアプリケーションの実際のプロセス ID に置き換えます。 プロファイリング セッションが完了したら、Visual Studio で cpu_usage.nettrace ファイルを開きます。
using System;
using System.Diagnostics;

class Program
{
    static void Main(string[] args)
    {
        var sw = new Stopwatch();
        sw.Start();
        // Simulate a CPU-intensive operation
        for (int i = 0; i < 1000000000; i++) { }
        sw.Stop();
        Console.WriteLine($"Elapsed Time: {sw.ElapsedMilliseconds} ms");
    }
}
using System;
using System.Diagnostics;
class Program
{
static void Main(string[] args)
{
var sw = new Stopwatch();
sw.Start();
// Simulate a CPU-intensive operation
for (int i = 0; i < 1000000000; i++) { }
sw.Stop();
Console.WriteLine($"Elapsed Time: {sw.ElapsedMilliseconds} ms");
}
}Imports System
Imports System.Diagnostics
Friend Class Program
Shared Sub Main(ByVal args() As String)
Dim sw = New Stopwatch()
sw.Start()
' Simulate a CPU-intensive operation
For i As Integer = 0 To 999999999
Next i
sw.Stop()
Console.WriteLine($"Elapsed Time: {sw.ElapsedMilliseconds} ms")
End Sub
End ClassこのコードはCPU集中的な操作をシミュレートしています。 cpu_usage.nettrace ファイルを分析すると、ループにかなりの CPU 時間がかかっていることがわかります。
メモリアロケーションの監視
Dottrace .NET Coreは、アプリケーションのメモリアロケーションを監視することもできます。 これは、メモリリークを特定し、メモリ使用量を最適化するために重要です。
アプリケーションを実行し、メモリアロケーションデータを収集します。
dotnet trace collect --process-id <your-process-id> --output memory_allocation.nettracedotnet trace collect --process-id <your-process-id> --output memory_allocation.nettraceセッション終了後、Visual Studio で memory_allocation.nettrace ファイルを開きます。
using System;

class Program
{
    static void Main(string[] args)
    {
        for (int i = 0; i < 10000; i++)
        {
            var data = new byte[1024]; // Allocate 1KB
        }
        Console.WriteLine("Memory allocation completed.");
    }
}
using System;
class Program
{
static void Main(string[] args)
{
for (int i = 0; i < 10000; i++)
{
var data = new byte[1024]; // Allocate 1KB
}
Console.WriteLine("Memory allocation completed.");
}
}Imports System
Friend Class Program
Shared Sub Main(ByVal args() As String)
For i As Integer = 0 To 9999
Dim data = New Byte(1023){} ' Allocate 1KB
Next i
Console.WriteLine("Memory allocation completed.")
End Sub
End Classこのコードはループ内でメモリを割り当てています。memory_allocation.nettrace ファイルを分析すると、割り当てられたメモリ量とコード内のどこで発生しているかがわかります。
I/O操作のプロファイリング
I/O操作のプロファイリングは、他の重要な機能です。 ファイルの読み書きのパフォーマンスへの影響を理解するのに役立ちます。
アプリケーションを起動し、I/Oデータを収集します。
dotnet trace collect --process-id <your-process-id> --output io_operations.nettracedotnet trace collect --process-id <your-process-id> --output io_operations.nettrace分析のために Visual Studio で io_operations.nettrace ファイルを開きます。
using System;
using System.IO;

class Program
{
    static void Main(string[] args)
    {
        var filePath = "test.txt";
        // Write to file
        using (var writer = new StreamWriter(filePath))
        {
            for (int i = 0; i < 1000; i++)
            {
                writer.WriteLine("This is a test line.");
            }
        }
        // Read from file
        using (var reader = new StreamReader(filePath))
        {
            while (reader.ReadLine() != null) { }
        }
        Console.WriteLine("I/O operations completed.");
    }
}
using System;
using System.IO;
class Program
{
static void Main(string[] args)
{
var filePath = "test.txt";
// Write to file
using (var writer = new StreamWriter(filePath))
{
for (int i = 0; i < 1000; i++)
{
writer.WriteLine("This is a test line.");
}
}
// Read from file
using (var reader = new StreamReader(filePath))
{
while (reader.ReadLine() != null) { }
}
Console.WriteLine("I/O operations completed.");
}
}Imports System
Imports System.IO
Friend Class Program
Shared Sub Main(ByVal args() As String)
Dim filePath = "test.txt"
' Write to file
Using writer = New StreamWriter(filePath)
For i As Integer = 0 To 999
writer.WriteLine("This is a test line.")
Next i
End Using
' Read from file
Using reader = New StreamReader(filePath)
Do While reader.ReadLine() IsNot Nothing
Loop
End Using
Console.WriteLine("I/O operations completed.")
End Sub
End Classこのコードはファイルへの書き込みとファイルからの読み取りを行います。io_operations.nettrace ファイルを分析すると、I/O操作に費やされた時間がわかります。
パフォーマンスボトルネックの特定
パフォーマンスボトルネックを特定することは、Dottraceを使用する主な目的の一つです。 収集したトレースファイルを分析することで、コードの遅い部分を特定できます。
アプリケーションを起動し、パフォーマンスデータを収集します。
dotnet trace collect --process-id <your-process-id> --output performance_bottlenecks.nettracedotnet trace collect --process-id <your-process-id> --output performance_bottlenecks.nettraceVisual Studio で performance_bottlenecks.nettrace ファイルを開きます。
using System;
using System.Threading;

class Program
{
    static void Main(string[] args)
    {
        Console.WriteLine("Starting application...");
        // Simulate a time-consuming operation
        Thread.Sleep(5000);
        Console.WriteLine("Application finished.");
    }
}
using System;
using System.Threading;
class Program
{
static void Main(string[] args)
{
Console.WriteLine("Starting application...");
// Simulate a time-consuming operation
Thread.Sleep(5000);
Console.WriteLine("Application finished.");
}
}Imports System
Imports System.Threading
Friend Class Program
Shared Sub Main(ByVal args() As String)
Console.WriteLine("Starting application...")
' Simulate a time-consuming operation
Thread.Sleep(5000)
Console.WriteLine("Application finished.")
End Sub
End Classこのコードはアプリケーションの遅延をシミュレートしています。 performance_bottlenecks.nettrace ファイルを分析すると、最も時間がかかっている場所がわかり、その部分を最適化するのに役立ちます。
これらの例は、Dottrace .NET Coreの主要機能を網羅しています。 これでCPU使用率を分析し、メモリアロケーションを監視し、I/O操作をプロファイリングし、パフォーマンスボトルネックを特定し、プロダクション環境でプロファイリングすることができます。 各機能は、.NET Core アプリケーションの最適化と改善に役立ちます。
DottraceとIronPDFの統合
IronPDFの紹介

IronPDF は、C# アプリケーション内で PDF を簡単に生成、編集、管理できる強力な .NET ライブラリです。 新しいPDFをゼロから作成するにせよ、HTMLをPDFに変換するにせよ、既存のPDFを操作するにせよ、IronPDFはこれらのタスクを効率的に達成するための豊富な機能を提供します。 PDF生成および処理を必要とするアプリケーション、たとえばレポートシステム、文書管理ソリューション、ウェブアプリケーションに有益です。
DottraceとIronPDFの統合のユースケース
ユーザー向けにPDFレポートを生成するWebアプリケーションのシナリオを考えてみましょう。 Dottraceを使用することで、PDF生成プロセスのパフォーマンスを追跡し、トレースファイルを使用してパフォーマンスの問題を特定し、ユーザーエクスペリエンスを向上させるための改善を行うことができます。 この統合は、大量のPDFドキュメントを処理するアプリケーションや高パフォーマンスの処理を必要とするアプリケーションに特に価値があります。
ユースケースのコード例
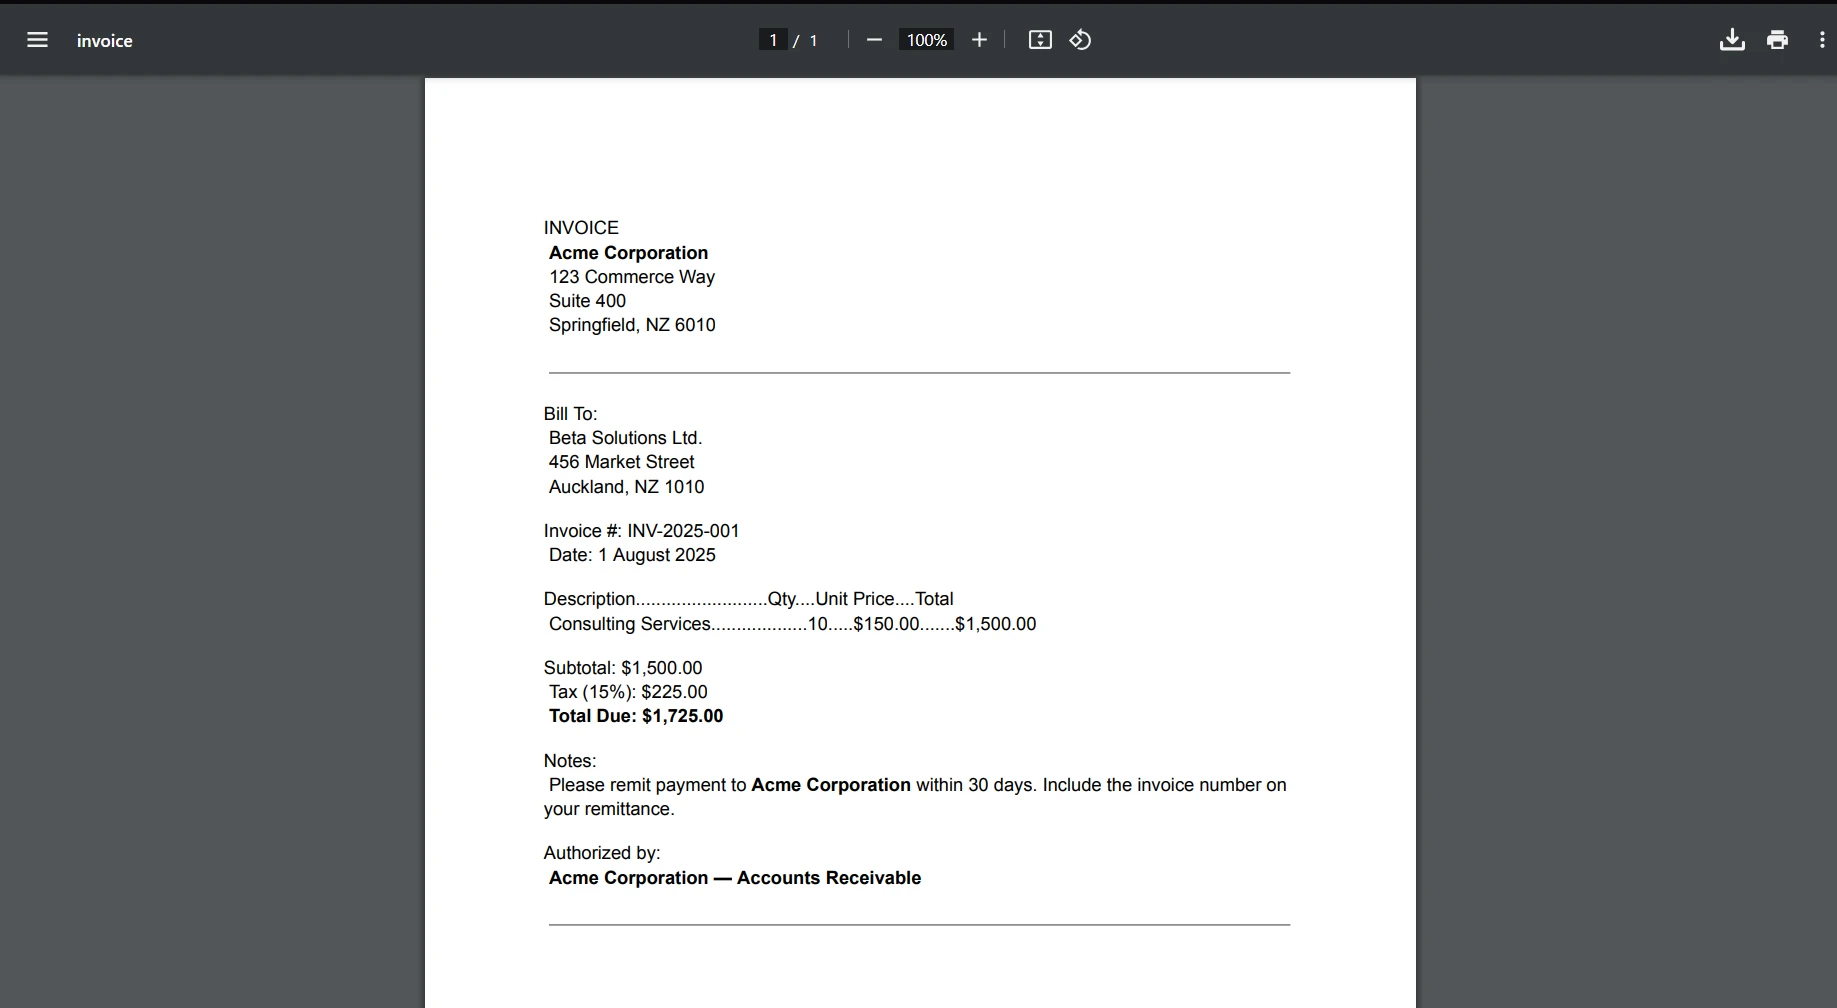
以下は、IronPDFとDottraceを統合する方法を示す完全なコード例です。 この例では、簡単なHTMLからPDFへの変換を行い、その操作のパフォーマンスをDottraceを使って監視します。
using System;
using IronPdf;
using Microsoft.Diagnostics.Tracing;
using Microsoft.Diagnostics.Tracing.Session;

class Program
{
    static void Main(string[] args)
    {
        // Start tracing session
        using (var session = new TraceEventSession("MySession"))
        {
            session.EnableProvider("Microsoft-Windows-DotNETRuntime");
            // Perform PDF generation
            var pdfDocument = GeneratePdf("Hello, world!");
            // Save the PDF to a file
            pdfDocument.SaveAs("example.pdf");
            // Stop tracing session
            session.Stop();
        }
        Console.WriteLine("PDF generated and performance traced successfully.");
    }

    static PdfDocument GeneratePdf(string htmlContent)
    {
        // Create an instance of the HtmlToPdf renderer
        var renderer = new ChromePdfRenderer();
        // Convert HTML to PDF
        var pdfDocument = renderer.RenderHtmlAsPdf(htmlContent);
        return pdfDocument;
    }
}
using System;
using IronPdf;
using Microsoft.Diagnostics.Tracing;
using Microsoft.Diagnostics.Tracing.Session;
class Program
{
static void Main(string[] args)
{
// Start tracing session
using (var session = new TraceEventSession("MySession"))
{
session.EnableProvider("Microsoft-Windows-DotNETRuntime");
// Perform PDF generation
var pdfDocument = GeneratePdf("Hello, world!");
// Save the PDF to a file
pdfDocument.SaveAs("example.pdf");
// Stop tracing session
session.Stop();
}
Console.WriteLine("PDF generated and performance traced successfully.");
}
static PdfDocument GeneratePdf(string htmlContent)
{
// Create an instance of the HtmlToPdf renderer
var renderer = new ChromePdfRenderer();
// Convert HTML to PDF
var pdfDocument = renderer.RenderHtmlAsPdf(htmlContent);
return pdfDocument;
}
}Imports System
Imports IronPdf
Imports Microsoft.Diagnostics.Tracing
Imports Microsoft.Diagnostics.Tracing.Session
Friend Class Program
Shared Sub Main(ByVal args() As String)
' Start tracing session
Using session = New TraceEventSession("MySession")
session.EnableProvider("Microsoft-Windows-DotNETRuntime")
' Perform PDF generation
Dim pdfDocument = GeneratePdf("Hello, world!")
' Save the PDF to a file
pdfDocument.SaveAs("example.pdf")
' Stop tracing session
session.Stop()
End Using
Console.WriteLine("PDF generated and performance traced successfully.")
End Sub
Private Shared Function GeneratePdf(ByVal htmlContent As String) As PdfDocument
' Create an instance of the HtmlToPdf renderer
Dim renderer = New ChromePdfRenderer()
' Convert HTML to PDF
Dim pdfDocument = renderer.RenderHtmlAsPdf(htmlContent)
Return pdfDocument
End Function
End Class
この例では、まず、Dottrace を使用してパフォーマンス データをキャプチャするための TraceEventSession を作成します。 次に、IronPDFを使用して簡単なHTML文字列からPDFを生成します。 PDFを保存した後、トレースセッションを停止します。

これにより、PDF生成プロセスのパフォーマンスを監視し、その実行に関する貴重な洞察を得ることができます。
結論
IronPDFライセンスオプションページを探索して、利用可能なライセンスとそれぞれの価格について学んでください。
DottraceをIronPDFと統合することで、PDF生成プロセスのパフォーマンスと信頼性を大幅に向上させることができます。 この統合により、アプリケーションがPDFタスクをどのように処理するかに関する貴重な洞察が得られ、操作を最適化し、スムーズなユーザーエクスペリエンスを保証するのに役立ちます。 IronPDF はPDF を操作するための包括的な機能セットを提供しており、あらゆる .NET 開発者にとって必須のツールとなっています。
IronPDFでは無料トライアルを提供しており、ライセンスは $999 から始まるため、購入前にその機能を評価することができます。 DottraceとIronPDFの力を組み合わせることで、高性能で効率的なアプリケーションを作成し、ユーザーのニーズを満たすことができます。
よくある質問
Dottrace .NET Coreとは何ですか?
Dottrace .NET Coreは、パフォーマンスプロファイリングに不可欠なツールとして.NETエコシステムにおける強力なツールです。これにより、開発者は実行中のプロセスのランタイムイベントに関する詳細なトレースファイルをキャプチャできます。
C# で HTML を PDF に変換するにはどうすればいいですか?
IronPDF の RenderHtmlAsPdf メソッドを使用して、HTML 文字列を PDF に変換できます。RenderHtmlFileAsPdf を使用して HTML ファイルを PDF に変換することもできます。
Dottraceは.NETアプリケーションの最適化にどのように役立ちますか?
Dottraceは、CPU使用率を分析し、メモリ割り当てを監視し、I/O操作をプロファイルし、パフォーマンスボトルネックを特定することで.NETアプリケーションを最適化し、開発者がアプリケーションの効率を向上させることを可能にします。
DottraceをPDFライブラリと併用できますか?
はい、DottraceはIronPDFのようなライブラリと統合して、PDF関連操作のパフォーマンスを監視し、PDFを処理するアプリケーションのパフォーマンス問題を特定して最適化するのに役立ちます。
.NETプロジェクトにDottraceをセットアップするプロセスは何ですか?
Visual StudioでNuGetを通じてDottraceをインストールして.NETプロジェクトにセットアップしてください。NuGetパッケージマネージャーを使用して「JetBrains.dotTrace.CommandLineTools」を検索してインストールします。
Dottraceは本番環境でどのようにアプリケーションパフォーマンスを向上させることができますか?
Dottraceは本番環境で実際の条件下でアプリケーションをプロファイルし、トレースデータをキャプチャしてパフォーマンスの問題を特定し、解決することでアプリケーションのパフォーマンスを向上させるのに役立ちます。
Dottraceが提供するパフォーマンスプロファイリングのための機能は何ですか?
Dottraceは、CPU使用率分析、メモリ監視、I/O操作のプロファイルを通じてパフォーマンスボトルネックを特定する機能を提供し、.NET Coreアプリケーションを最適化します。
なぜI/O操作をプロファイルすることが重要なのですか?
I/O操作をプロファイルすることで、ファイルの読み書きのパフォーマンス影響を理解し、開発者がボトルネックを特定してアプリケーション性能を向上させることができます。
パフォーマンスプロファイリングツールはメモリ管理にどのように役立ちますか?
Dottraceのようなパフォーマンスプロファイリングツールは、メモリ割り当てに関するデータを収集し、開発者が使用パターンを分析し、潜在的なメモリリークを特定するのに役立ちます。
開発におけるパフォーマンスプロファイリングツールの利点は何ですか?
パフォーマンスプロファイリングツールは、アプリケーションの詳細な洞察を提供し、開発者がコードを最適化して信頼性を確保し、ランタイムの挙動を深く理解できるようにします。