Dottrace .NET Core (개발자를 위한 작동 방식)
강력한 .NET 생태계 도구 Dottrace .NET Core를 소개합니다. 이는 성능 프로파일링의 필수 .NET 도구로 역할합니다. .NET 추적 도구인 .NET 성능 프로파일러는 개발자가 실행 중인 프로세스의 런타임 이벤트에 대한 인사이트를 제공하는 상세한 추적 파일을 캡처할 수 있게 해줍니다. 이 도구는 .NET 프레임워크로 빌드된 애플리케이션을 최적화하는 데 필수적입니다.
단위 테스트를 수행하거나 지속적인 통합 빌드를 통합할 때, Dottrace를 사용하면 애플리케이션의 성능을 효과적으로 모니터링하고 분석할 수 있습니다. 이 도구를 활용함으로써 애플리케이션의 동작을 깊이 이해하고 최적의 성능과 안정성을 보장할 수 있습니다.
IronPDF는 .NET 애플리케이션에서 PDF를 다루는 포괄적인 라이브러리입니다. PDF 파일을 생성, 편집 및 내용 추출할 수 있습니다. IronPDF는 HTML에서 PDF로의 변환, PDF 병합 및 분할과 같은 기능을 지원합니다. 이 라이브러리는 PDF 문서를 생성하거나 조작해야 하는 모든 애플리케이션에 유용한 도구입니다. 이 글에서는 Dottrace와 함께 이 라이브러리를 사용하여 Dottrace와 IronPDF의 실효성을 현실적으로 표현할 것입니다.
Dottrace .NET Core 시작하기
.NET 프로젝트에서 Dottrace .NET Core 설치하기
먼저 NuGet을 사용하여 Dottrace .NET Core를 설치해야 합니다. Visual Studio를 열고 다음 단계를 따르세요:
- Visual Studio를 엽니다.
- 새 프로젝트 만들기를 선택하세요.
- 콘솔 앱 (.NET Core)을 선택하고 다음을 클릭하세요.
- 프로젝트 이름을
DottraceExample으로 지정하고 생성을 클릭하세요. 솔루션 탐색기에서 프로젝트를 마우스 오른쪽 버튼으로 클릭하고 NuGet 패키지 관리를 선택하세요. - NuGet 패키지 관리자에서
JetBrains.dotTrace.CommandLineTools를 검색하세요. 패키지를 선택하고 설치를 클릭하세요.
이렇게 하면 프로젝트에 Dottrace가 종속성으로 설치됩니다.

간단한 콘솔 애플리케이션 프로파일링하기
프로파일링을 위해 기본 콘솔 애플리케이션을 만들어 봅시다. Program.cs의 코드를 다음으로 바꾸세요:
using System;
using System.Threading;

class Program
{
    static void Main(string[] args)
    {
        Console.WriteLine("Starting application...");
        // Simulating a time-consuming operation
        Thread.Sleep(5000);
        Console.WriteLine("Application finished.");
    }
}
using System;
using System.Threading;
class Program
{
static void Main(string[] args)
{
Console.WriteLine("Starting application...");
// Simulating a time-consuming operation
Thread.Sleep(5000);
Console.WriteLine("Application finished.");
}
}Imports System
Imports System.Threading
Friend Class Program
Shared Sub Main(ByVal args() As String)
Console.WriteLine("Starting application...")
' Simulating a time-consuming operation
Thread.Sleep(5000)
Console.WriteLine("Application finished.")
End Sub
End ClassF5 키를 눌러 애플리케이션을 빌드하고 실행하세요. 애플리케이션이 실행된 후 프로파일링을 위해 해당 프로세스 ID가 필요합니다. Visual Studio의 진단 도구 창을 사용하거나 작업 관리자를 확인하여 프로세스 ID를 찾을 수 있습니다.
Dottrace를 사용하여 애플리케이션을 프로파일링하려면 터미널 창 또는 Visual Studio의 패키지 관리자 콘솔을 열고 다음 명령을 실행하세요:
dotnet trace collect --process-id <your-process-id> --output trace.nettracedotnet trace collect --process-id <your-process-id> --output trace.nettrace실제 실행 중인 애플리케이션의 프로세스 ID로 <your-process-id>를 대체하세요.
애플리케이션이 종료되면 trace.nettrace 파일이 생성됩니다. 이 파일에 애플리케이션 실행 도중 수집된 모든 프로파일링 데이터가 포함됩니다. 이 파일을 Visual Studio에서 분석할 수 있습니다. 다음 단계를 따르세요:
- Visual Studio를 엽니다.
- 파일 > 열기 > 파일로 이동하세요.
trace.nettrace파일을 선택하고 열기를 클릭하세요.
Visual Studio는 성능 데이터를 자세히 표시하여 성능 병목현상을 식별하고 수정할 수 있도록 합니다.
이제 Dottrace를 설정하고 기본 프로파일링 예제를 생성했으므로 더 고급 기능을 구현할 수 있습니다.
Dottrace .NET Core 기능 구현
CPU 사용량 분석하기
Dottrace .NET Core의 주요 기능 중 하나는 CPU 사용량 분석입니다. 이것은 코드의 어떤 부분이 가장 많은 CPU 리소스를 소비하는지 식별하는 데 도움이 됩니다. 방법은 다음과 같습니다.
먼저 Visual Studio에서 애플리케이션을 시작하세요. 그런 다음, 터미널이나 패키지 관리자 콘솔에서 실행하십시오:
dotnet trace collect --process-id <your-process-id> --output cpu_usage.nettracedotnet trace collect --process-id <your-process-id> --output cpu_usage.nettrace애플리케이션의 실제 프로세스 ID로 <your-process-id>를 대체하세요. 프로파일링 세션이 완료되면 cpu_usage.nettrace 파일을 Visual Studio에서 열어보세요:
using System;
using System.Diagnostics;

class Program
{
    static void Main(string[] args)
    {
        var sw = new Stopwatch();
        sw.Start();
        // Simulate a CPU-intensive operation
        for (int i = 0; i < 1000000000; i++) { }
        sw.Stop();
        Console.WriteLine($"Elapsed Time: {sw.ElapsedMilliseconds} ms");
    }
}
using System;
using System.Diagnostics;
class Program
{
static void Main(string[] args)
{
var sw = new Stopwatch();
sw.Start();
// Simulate a CPU-intensive operation
for (int i = 0; i < 1000000000; i++) { }
sw.Stop();
Console.WriteLine($"Elapsed Time: {sw.ElapsedMilliseconds} ms");
}
}Imports System
Imports System.Diagnostics
Friend Class Program
Shared Sub Main(ByVal args() As String)
Dim sw = New Stopwatch()
sw.Start()
' Simulate a CPU-intensive operation
For i As Integer = 0 To 999999999
Next i
sw.Stop()
Console.WriteLine($"Elapsed Time: {sw.ElapsedMilliseconds} ms")
End Sub
End Class이 코드는 CPU집약적인 작업을 시뮬레이션합니다. cpu_usage.nettrace 파일을 분석할 때 루프가 상당한 CPU 시간을 소비하고 있는 것을 볼 수 있습니다.
메모리 할당 모니터링
Dottrace .NET Core는 애플리케이션의 메모리 할당을 모니터링하는 데에도 도움을 줄 수 있습니다. 이는 메모리 누수를 식별하고 메모리 사용을 최적화하는 데 중요합니다.
애플리케이션을 실행하고 메모리 할당 데이터를 수집하십시오:
dotnet trace collect --process-id <your-process-id> --output memory_allocation.nettracedotnet trace collect --process-id <your-process-id> --output memory_allocation.nettrace세션 후, Visual Studio에서 memory_allocation.nettrace 파일을 여세요:
using System;

class Program
{
    static void Main(string[] args)
    {
        for (int i = 0; i < 10000; i++)
        {
            var data = new byte[1024]; // Allocate 1KB
        }
        Console.WriteLine("Memory allocation completed.");
    }
}
using System;
class Program
{
static void Main(string[] args)
{
for (int i = 0; i < 10000; i++)
{
var data = new byte[1024]; // Allocate 1KB
}
Console.WriteLine("Memory allocation completed.");
}
}Imports System
Friend Class Program
Shared Sub Main(ByVal args() As String)
For i As Integer = 0 To 9999
Dim data = New Byte(1023){} ' Allocate 1KB
Next i
Console.WriteLine("Memory allocation completed.")
End Sub
End Class이 코드는 루프 내에서 메모리를 할당합니다. memory_allocation.nettrace 파일을 분석하면 메모리가 할당되는 양과 코드 내에서 발생하는 위치를 보여줍니다.
I/O 작업 프로파일링
I/O 작업 프로파일링은 또 다른 필수 기능입니다. 파일 읽기 및 쓰기의 성능 영향을 이해하는 데 도움이 됩니다.
애플리케이션을 시작하고 I/O 데이터를 수집하십시오:
dotnet trace collect --process-id <your-process-id> --output io_operations.nettracedotnet trace collect --process-id <your-process-id> --output io_operations.nettrace분석을 위해 Visual Studio에서 io_operations.nettrace 파일을 여세요:
using System;
using System.IO;

class Program
{
    static void Main(string[] args)
    {
        var filePath = "test.txt";
        // Write to file
        using (var writer = new StreamWriter(filePath))
        {
            for (int i = 0; i < 1000; i++)
            {
                writer.WriteLine("This is a test line.");
            }
        }
        // Read from file
        using (var reader = new StreamReader(filePath))
        {
            while (reader.ReadLine() != null) { }
        }
        Console.WriteLine("I/O operations completed.");
    }
}
using System;
using System.IO;
class Program
{
static void Main(string[] args)
{
var filePath = "test.txt";
// Write to file
using (var writer = new StreamWriter(filePath))
{
for (int i = 0; i < 1000; i++)
{
writer.WriteLine("This is a test line.");
}
}
// Read from file
using (var reader = new StreamReader(filePath))
{
while (reader.ReadLine() != null) { }
}
Console.WriteLine("I/O operations completed.");
}
}Imports System
Imports System.IO
Friend Class Program
Shared Sub Main(ByVal args() As String)
Dim filePath = "test.txt"
' Write to file
Using writer = New StreamWriter(filePath)
For i As Integer = 0 To 999
writer.WriteLine("This is a test line.")
Next i
End Using
' Read from file
Using reader = New StreamReader(filePath)
Do While reader.ReadLine() IsNot Nothing
Loop
End Using
Console.WriteLine("I/O operations completed.")
End Sub
End Class이 코드는 파일을 읽고 씁니다. io_operations.nettrace 파일을 분석하면 I/O 작업에 소요된 시간을 드러냅니다.
성능 병목 현상 식별
성능 병목 현상을 식별하는 것은 Dottrace 사용의 주된 목적 중 하나입니다. 수집된 추적 파일을 분석하여 코드의 느린 부분을 정확히 찾아낼 수 있습니다.
애플리케이션을 시작하고 성능 데이터를 수집하십시오:
dotnet trace collect --process-id <your-process-id> --output performance_bottlenecks.nettracedotnet trace collect --process-id <your-process-id> --output performance_bottlenecks.nettraceVisual Studio에서 performance_bottlenecks.nettrace 파일을 여세요:
using System;
using System.Threading;

class Program
{
    static void Main(string[] args)
    {
        Console.WriteLine("Starting application...");
        // Simulate a time-consuming operation
        Thread.Sleep(5000);
        Console.WriteLine("Application finished.");
    }
}
using System;
using System.Threading;
class Program
{
static void Main(string[] args)
{
Console.WriteLine("Starting application...");
// Simulate a time-consuming operation
Thread.Sleep(5000);
Console.WriteLine("Application finished.");
}
}Imports System
Imports System.Threading
Friend Class Program
Shared Sub Main(ByVal args() As String)
Console.WriteLine("Starting application...")
' Simulate a time-consuming operation
Thread.Sleep(5000)
Console.WriteLine("Application finished.")
End Sub
End Class이 코드는 애플리케이션의 지연을 시뮬레이션합니다. performance_bottlenecks.nettrace 파일을 분석하면 가장 많은 시간이 소비된 부분을 보여주어 해당 부분을 최적화하는 데 도움이 됩니다.
이 예제는 Dottrace .NET Core의 주요 기능을 다룹니다. 이제 CPU 사용량 분석, 메모리 할당 모니터링, I/O 작업 프로파일링, 성능 병목 현상 식별, 프로덕션 환경에서의 프로파일링 등을 수행할 수 있습니다. 각 기능은 .NET Core 애플리케이션을 최적화하고 개선하는 데 도움을 줍니다.
IronPDF와의 Dottrace 통합
IronPDF 소개

IronPDF은 강력한 .NET 라이브러리로, C# 애플리케이션 내에서 PDF를 쉽게 생성, 편집 및 관리할 수 있게 해줍니다. 새로운 PDF를 처음부터 생성하거나, HTML을 PDF로 변환하거나, 기존 PDF를 조작해야 할 경우, IronPDF는 이러한 작업을 효율적으로 수행할 수 있는 풍부한 기능을 제공합니다. 보고서 시스템, 문서 관리 솔루션, 웹 애플리케이션 등 PDF 생성 및 처리가 필요한 애플리케이션에 유용합니다.
IronPDF와 Dottrace 통합의 사용 사례
사용자에게 PDF 보고서를 생성하는 웹 애플리케이션을 예로 들어보세요. Dottrace를 사용하면 PDF 생성 프로세스의 성능을 추적하고, 추적 파일을 사용해 성능 문제를 식별하며, 사용자 경험을 향상시키기 위한 개선을 할 수 있습니다. 이 통합은 대량의 PDF 문서를 처리하거나 고성능 처리가 필요한 애플리케이션에 특히 유용합니다.
사용 사례의 코드 예제
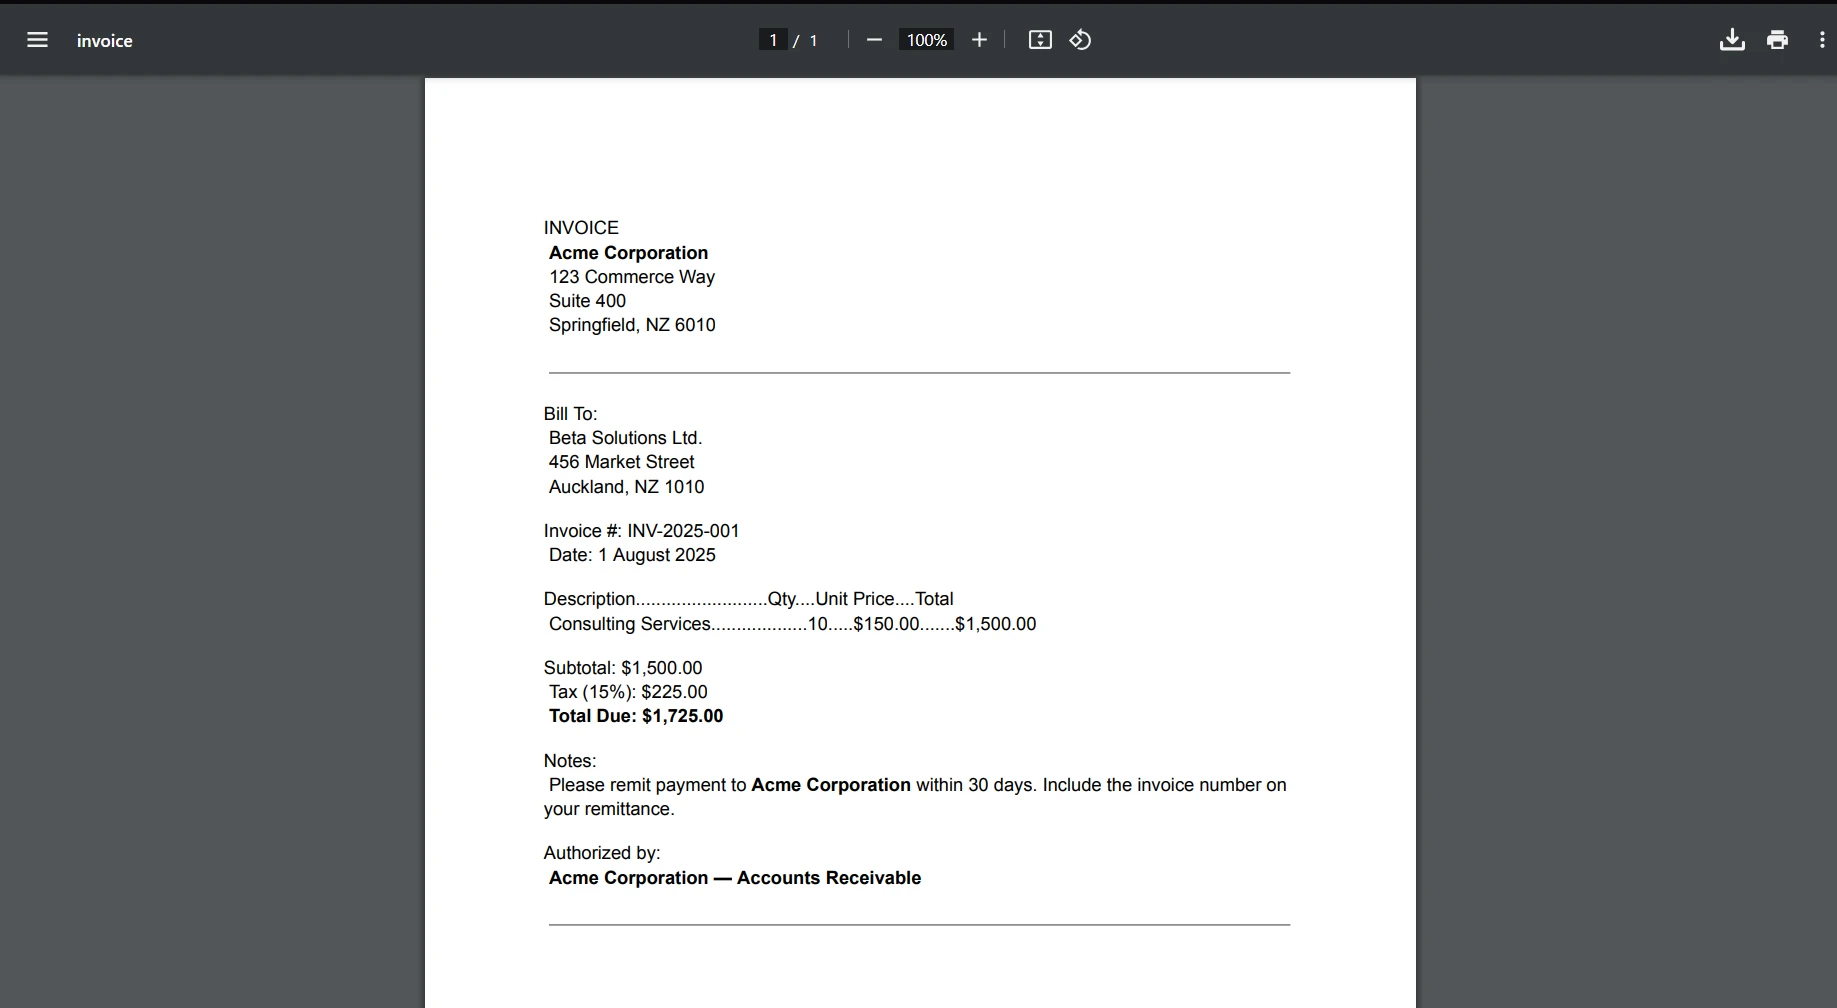
아래는 IronPDF를 Dottrace와 통합하는 방법을 보여주는 전체 코드 예제입니다. 이 예제는 간단한 HTML을 PDF로 변환하고 Dottrace를 사용하여 작업의 성능을 모니터링합니다.
using System;
using IronPdf;
using Microsoft.Diagnostics.Tracing;
using Microsoft.Diagnostics.Tracing.Session;

class Program
{
    static void Main(string[] args)
    {
        // Start tracing session
        using (var session = new TraceEventSession("MySession"))
        {
            session.EnableProvider("Microsoft-Windows-DotNETRuntime");
            // Perform PDF generation
            var pdfDocument = GeneratePdf("Hello, world!");
            // Save the PDF to a file
            pdfDocument.SaveAs("example.pdf");
            // Stop tracing session
            session.Stop();
        }
        Console.WriteLine("PDF generated and performance traced successfully.");
    }

    static PdfDocument GeneratePdf(string htmlContent)
    {
        // Create an instance of the HtmlToPdf renderer
        var renderer = new ChromePdfRenderer();
        // Convert HTML to PDF
        var pdfDocument = renderer.RenderHtmlAsPdf(htmlContent);
        return pdfDocument;
    }
}
using System;
using IronPdf;
using Microsoft.Diagnostics.Tracing;
using Microsoft.Diagnostics.Tracing.Session;
class Program
{
static void Main(string[] args)
{
// Start tracing session
using (var session = new TraceEventSession("MySession"))
{
session.EnableProvider("Microsoft-Windows-DotNETRuntime");
// Perform PDF generation
var pdfDocument = GeneratePdf("Hello, world!");
// Save the PDF to a file
pdfDocument.SaveAs("example.pdf");
// Stop tracing session
session.Stop();
}
Console.WriteLine("PDF generated and performance traced successfully.");
}
static PdfDocument GeneratePdf(string htmlContent)
{
// Create an instance of the HtmlToPdf renderer
var renderer = new ChromePdfRenderer();
// Convert HTML to PDF
var pdfDocument = renderer.RenderHtmlAsPdf(htmlContent);
return pdfDocument;
}
}Imports System
Imports IronPdf
Imports Microsoft.Diagnostics.Tracing
Imports Microsoft.Diagnostics.Tracing.Session
Friend Class Program
Shared Sub Main(ByVal args() As String)
' Start tracing session
Using session = New TraceEventSession("MySession")
session.EnableProvider("Microsoft-Windows-DotNETRuntime")
' Perform PDF generation
Dim pdfDocument = GeneratePdf("Hello, world!")
' Save the PDF to a file
pdfDocument.SaveAs("example.pdf")
' Stop tracing session
session.Stop()
End Using
Console.WriteLine("PDF generated and performance traced successfully.")
End Sub
Private Shared Function GeneratePdf(ByVal htmlContent As String) As PdfDocument
' Create an instance of the HtmlToPdf renderer
Dim renderer = New ChromePdfRenderer()
' Convert HTML to PDF
Dim pdfDocument = renderer.RenderHtmlAsPdf(htmlContent)
Return pdfDocument
End Function
End Class
이 예제에서는 Dottrace를 사용하여 성능 데이터를 캡처하기 위해 TraceEventSession을 생성하는 것으로 시작합니다. 그런 다음 IronPDF를 사용하여 간단한 HTML 문자열에서 PDF를 생성합니다. PDF를 저장한 후, 추적 세션을 종료합니다.

이는 PDF 생성 프로세스의 성능을 모니터링하고 실행에 대한 가치 있는 통찰력을 제공할 수 있게 합니다.
결론
using 가능한 라이선스 및 각 가격에 대해 알아보려면 IronPDF Licensing Options 페이지를 탐색하세요.
Dottrace와 IronPDF를 통합하면 PDF 생성 프로세스의 성능 및 신뢰성을 크게 향상시킬 수 있습니다. 이 통합은 애플리케이션이 PDF 작업을 처리하는 방식을 이해하는 데 귀중한 통찰력을 제공, 작업 최적화 및 매끄러운 사용자 경험을 보장합니다. IronPDF는 PDF 작업을 위한 종합적인 특징 세트를 제공하여 .NET 개발자에게 필수적인 도구입니다.
IronPDF는 무료 체험판을 제공하며, 라이선스는 $999에서 시작하여 구매 전에 기능을 평가할 수 있게 해줍니다. Dottrace와 IronPDF의 힘을 결합하면 사용자의 요구를 충족하는 고성능, 효율적인 애플리케이션을 생성할 수 있습니다.
자주 묻는 질문
Dottrace .NET Core란 무엇인가요?
Dottrace .NET Core는 .NET 생태계에서 강력한 도구로, 성능 프로파일링을 위한 필수 도구입니다. 개발자는 런타임 프로세스의 이벤트를 분석할 수 있도록 상세한 추적 파일을 캡처할 수 있습니다.
C#에서 HTML을 PDF로 변환하는 방법은 무엇인가요?
IronPDF의 RenderHtmlAsPdf 메서드를 사용하여 HTML 문자열을 PDF로 변환할 수 있습니다. 또한 RenderHtmlFileAsPdf 사용하여 HTML 파일을 PDF로 변환할 수도 있습니다.
Dottrace는 .NET 애플리케이션 최적화에 어떻게 도움을 주나요?
Dottrace는 .NET 애플리케이션에서 CPU 사용량을 분석하고, 메모리 할당을 모니터링하며, I/O 작업을 프로파일링하고, 성능 병목 현상을 식별하여 애플리케이션 효율성을 향상시키는 데 도움을 줍니다.
Dottrace를 PDF 라이브러리와 함께 사용할 수 있나요?
예, Dottrace는 IronPDF와 같은 라이브러리와 통합하여 PDF 관련 작업의 성능을 모니터링하고, PDF를 처리하는 애플리케이션의 성능 문제를 식별 및 최적화하는 데 도움을 줍니다.
Dottrace를 .NET 프로젝트에 설정하는 과정은 무엇인가요?
Visual Studio에서 NuGet을 통해 'JetBrains.dotTrace.CommandLineTools'를 검색 및 설치하여 .NET 프로젝트에 Dottrace를 설정합니다.
Dottrace는 실제 환경에서 애플리케이션 성능을 어떻게 향상시킬 수 있나요?
Dottrace는 실제 환경에서 애플리케이션을 프로파일링하여 성능 문제를 식별하고 해결할 수 있는 추적 데이터를 캡처하여 애플리케이션 성능을 향상시킬 수 있습니다.
Dottrace는 성능 프로파일링을 위해 어떤 기능을 제공하나요?
Dottrace는 CPU 사용량 분석, 메모리 할당 모니터링, I/O 작업 프로파일링, 성능 병목 현상 식별 등 .NET Core 애플리케이션을 최적화하기 위한 기능을 제공합니다.
I/O 작업을 프로파일링하는 것이 왜 중요합니까?
I/O 작업을 프로파일링하는 것은 파일 읽기/쓰기 작업의 성능 영향을 이해하고, 병목 현상을 식별하여 애플리케이션 성능을 향상시키기 위해 최적화할 수 있습니다.
성능 프로파일링 도구는 메모리 관리에 어떻게 도움을 주나요?
Dottrace와 같은 성능 프로파일링 도구는 메모리 할당 데이터를 수집하고, 사용 패턴을 분석하여 잠재적 메모리 누수를 식별하는 데 도움을 줍니다.
개발 단계에서 성능 프로파일링 도구를 사용하는 이점은 무엇인가요?
성능 프로파일링 도구는 애플리케이션 성능에 대한 상세한 인사이트를 제공하여 코드 최적화, 신뢰성 확보 및 런타임 동안 애플리케이션 동작을 심층적으로 이해하는 데 도움을 줍니다.