Seaborn Python (How it Works for Developers Guide)
Statistical data visualization Seaborn is a popular Python visualization library. It is built on top of the Matplotlib Python module and provides a high-level interface for drawing attractive and informative statistical graphics. Seaborn is particularly well-suited for visualizing complex datasets and making data analysis more intuitive. Later in this article, we will also look into IronPDF, a PDF generation and manipulation library from IronSoftware.
Key Features
- High-Level Interface: Seaborn provides a high-level interface, simplifying the process of creating complex visualizations. This means you can make sophisticated plots with just a few lines of code.
- Integration with Pandas: Seaborn works seamlessly with Pandas data structures, making it easy to visualize data stored in DataFrames.
- Beautiful Default Styles: Seaborn comes with beautiful default styles and color palettes, which help make the plots more attractive and more accessible to interpret.
Statistical Estimation: Seaborn includes functions for estimating and plotting statistical relationships, such as regression lines and confidence intervals.
Univariate and Bivariate Distributions: Seaborn supports statistical data visualization with
Univariate Distributions in Seaborn
- Histogram: Visualizes the frequency of data points in bins.
- KDE Plot: Shows a smooth curve representing data density.
- ECDF Plot: Displays the cumulative proportion of data points.
- Box Plot: Illustrates data distribution with quartiles and outliers.
Bivariate Distributions in Seaborn
- Scatter Plot: Depicts the relationship between two variables.
- Hexbin Plot: Uses hexagonal bins to show data density.
- Bivariate KDE Plot: Smooth density plot for two variables.
- Pair Plot: Shows pairwise relationships in a dataset.
Getting Started
To get started with Seaborn, you need to install it using pip:
pip install seabornpip install seabornOnce installed, you can import Seaborn along with Matplotlib and create visualizations. Here’s a simple example:
import seaborn as sns
import matplotlib.pyplot as plt
# Load an example dataset
tips = sns.load_dataset("tips")
# Create a simple scatter plot
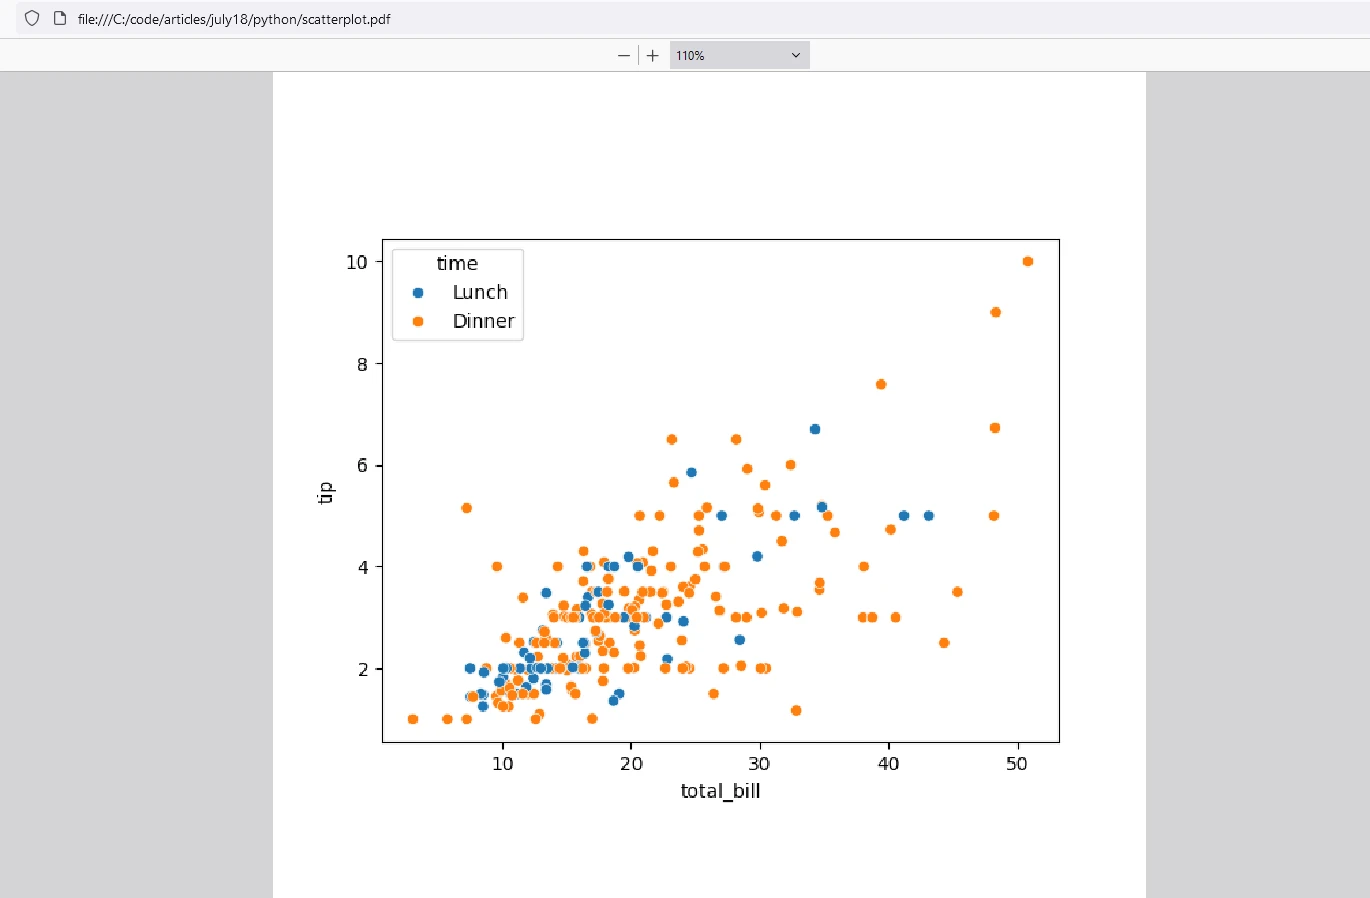
sns.scatterplot(data=tips, x="total_bill", y="tip", hue="time")
plt.show()import seaborn as sns
import matplotlib.pyplot as plt
# Load an example dataset
tips = sns.load_dataset("tips")
# Create a simple scatter plot
sns.scatterplot(data=tips, x="total_bill", y="tip", hue="time")
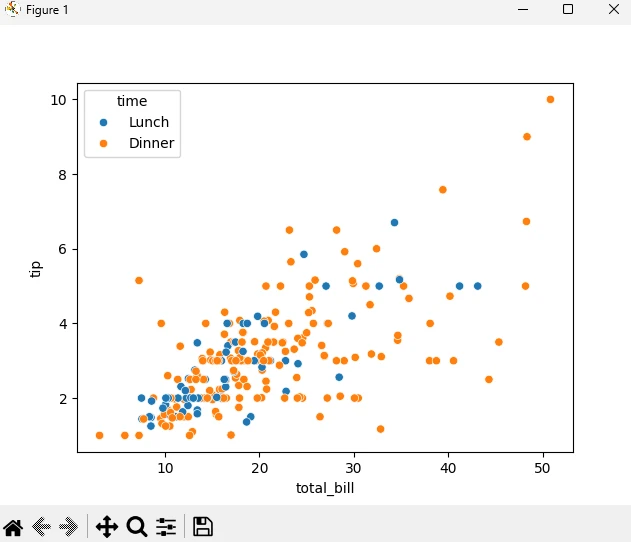
plt.show()In this example, we load the “tips” dataset and create a scatter plot showing the relationship between the total bill and the tip amount, with different colors representing different times of the day.
Output
Commonly Used Plots
Relational Plots: These plots show relationships between variables. Examples include scatter plots and line plots.
sns.relplot(data=tips, x="total_bill", y="tip", hue="smoker", style="time")
plt.show()
sns.relplot(data=tips, x="total_bill", y="tip", hue="smoker", style="time") plt.show()PYTHON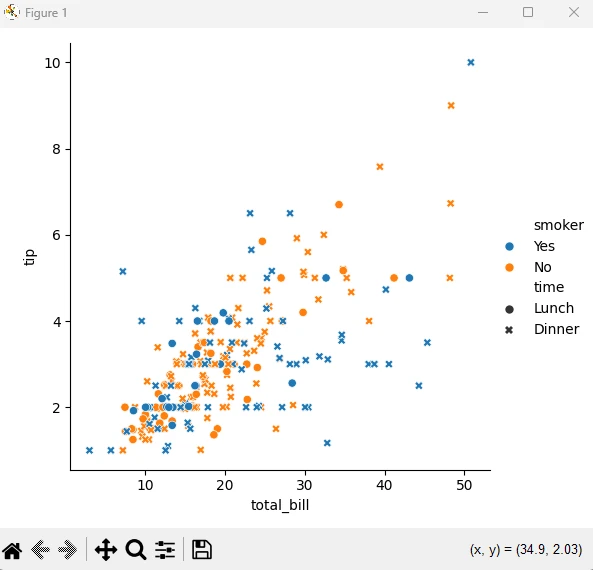
Categorical Plots: These plots visualize categorical data. Examples include bar plots, box plots, and violin plots.
sns.boxplot(data=tips, x="day", y="total_bill", hue="smoker")
plt.show()
sns.boxplot(data=tips, x="day", y="total_bill", hue="smoker") plt.show()PYTHON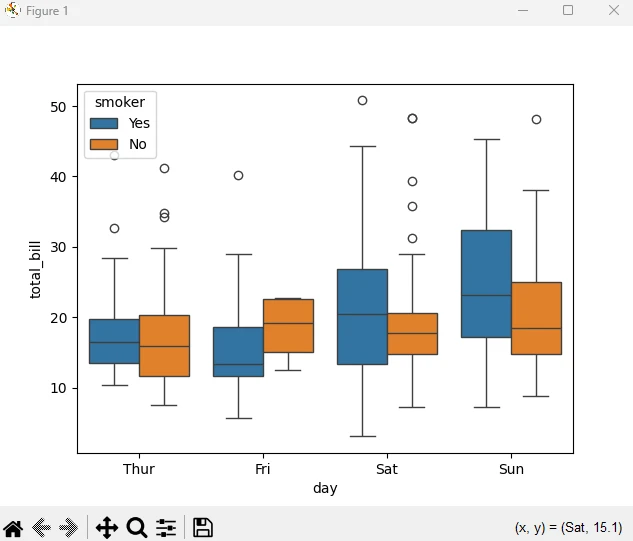
Distribution Plots: Examples include histograms and kernel density estimation.
sns.histplot(data=tips, x="total_bill", kde=True)
plt.show()
sns.histplot(data=tips, x="total_bill", kde=True) plt.show()PYTHON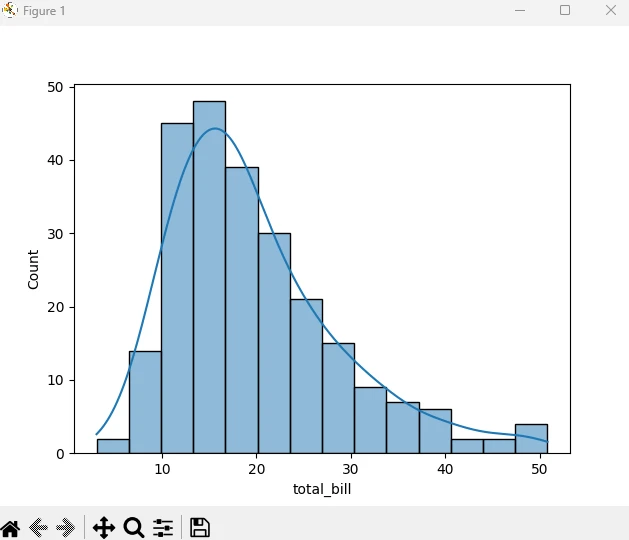
Matrix Plots: These plots visualize data in matrix form. Examples include heat maps and cluster maps.
glue = sns.load_dataset("glue").pivot(index="Model", columns="Task", values="Score")
sns.heatmap(glue)
plt.show()
glue = sns.load_dataset("glue").pivot(index="Model", columns="Task", values="Score") sns.heatmap(glue) plt.show()PYTHON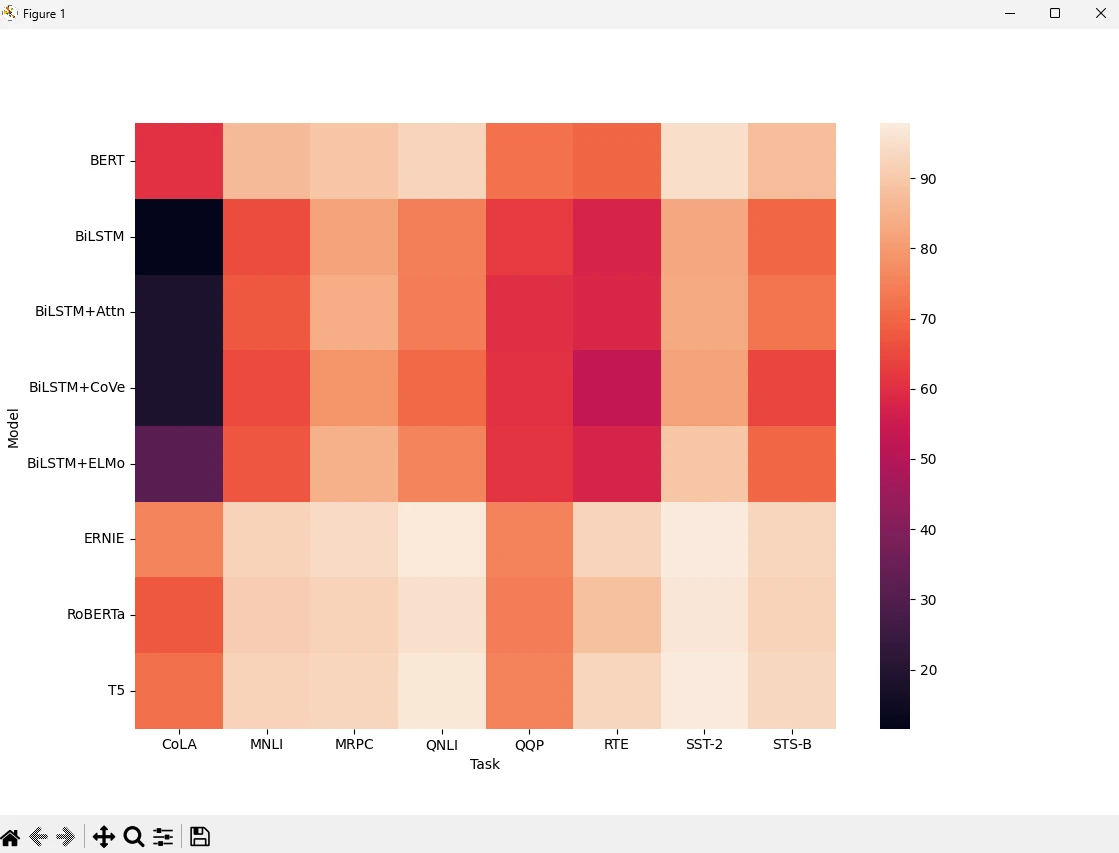
Seaborn plots can also be used for distribution plot graphs, line plot graphs, box plots, and bar plots, and plotting code with real-world data or statistical data is effortless.
Customization
Seaborn allows extensive customization of plots. You can change the plot's style, color palette, and other aspects to suit your needs. For example, you can set the theme using:
sns.set_theme(style="whitegrid")sns.set_theme(style="whitegrid")Introducing IronPDF
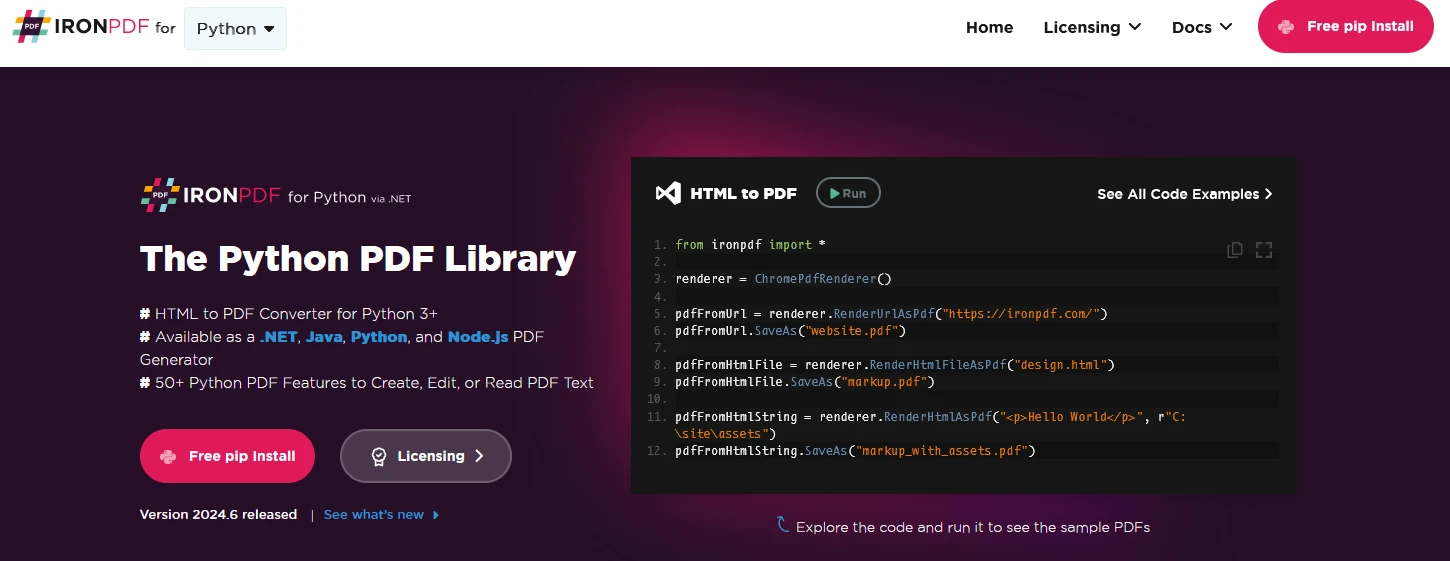
IronPDF is a powerful Python library designed to create, edit, and sign PDFs using HTML, CSS, images, and JavaScript. It delivers high-quality performance while using minimal memory. Key features include:
HTML to PDF Conversion:
Convert HTML files, HTML strings, and URLs into PDFs. For example, use the Chrome PDF renderer to render a webpage as a PDF.
Cross-Platform Support:
IronPDF is designed for Python 3+ and also runs on Windows, Mac, Linux, or Cloud Platforms.
IronPDF is also available in .NET, Java, Python, and Node.js.Editing and Signing:
Set properties, apply passwords and permissions, and add digital signatures to your PDFs.
Page Templates and Settings:
You can customize PDFs with headers, footers, page numbers, and adjustable margins. It additionally supports custom paper sizes and responsive layouts.
Standards Compliance:
Complies with PDF standards, including PDF/A and PDF/UA, supports UTF-8 character encoding, and manages assets such as images, CSS, and fonts.
Installation
pip install ironpdfpip install ironpdfGenerate PDF Documents using IronPDF and Seaborn
Prerequisites
- Make sure Visual Studio Code is installed as the code editor.
- Python version 3 is installed.
To start with, let's create a Python file to add our scripts.
Open Visual Studio Code and create a file, seabornDemo.py.
Install necessary libraries:
pip install seaborn
pip install ironpdf
pip install seaborn
pip install ironpdfThen add the below code to demonstrate the usage of IronPDF and Seaborn Python packages:
import seaborn as sns
import matplotlib.pyplot as plt
from ironpdf import *

# Apply your license key
License.LicenseKey = "your key here"

# Load an example dataset
tips = sns.load_dataset("tips")
print(tips)

# Create a simple scatter plot
sns.scatterplot(data=tips, x="total_bill", y="tip", hue="time")

# Save the plot as a PNG file
plt.savefig("scatterplot.png")

# Convert the image to PDF using IronPDF
ImageToPdfConverter.ImageToPdf("scatterplot.png").SaveAs("scatterplot.pdf")

# Display the plot
plt.show()
import seaborn as sns
import matplotlib.pyplot as plt
from ironpdf import *
# Apply your license key
License.LicenseKey = "your key here"
# Load an example dataset
tips = sns.load_dataset("tips")
print(tips)
# Create a simple scatter plot
sns.scatterplot(data=tips, x="total_bill", y="tip", hue="time")
# Save the plot as a PNG file
plt.savefig("scatterplot.png")
# Convert the image to PDF using IronPDF
ImageToPdfConverter.ImageToPdf("scatterplot.png").SaveAs("scatterplot.pdf")
# Display the plot
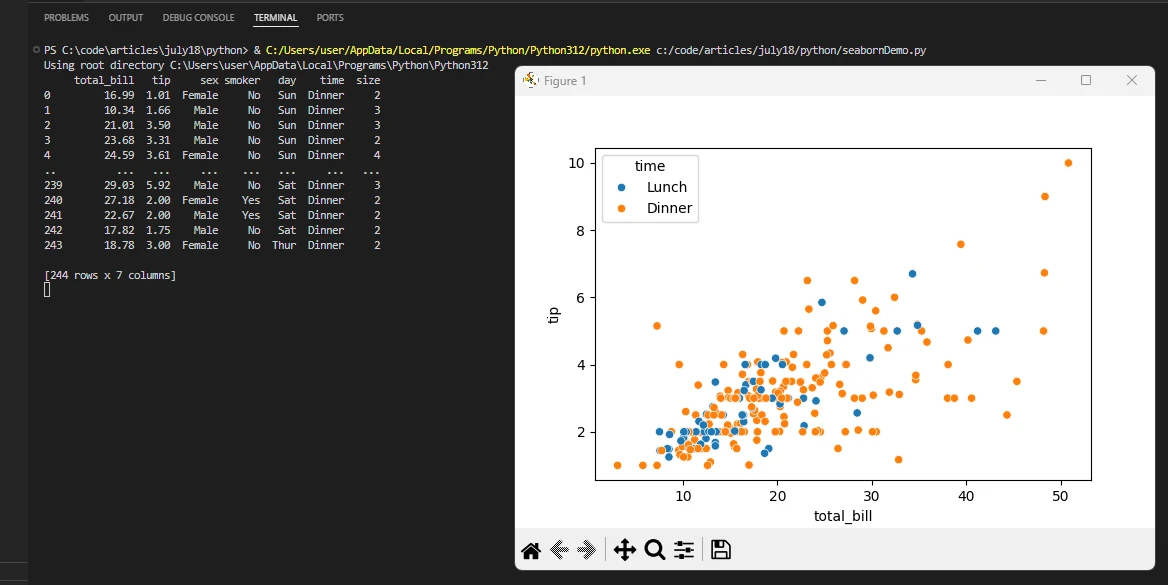
plt.show()Code Explanation
In this example, we use the "tips" dataset to plot a scatter plot, save it as an image, and convert it to a PDF using IronPDF.
- Import Libraries: Import necessary libraries for data visualization and PDF generation.
- License Key: Adding a License Key is necessary for the IronPDF library to work.
- Load Dataset: Load the sample dataset "tips".
- Print DataFrame: Print the DataFrame to view it in the output.
- Create Plot: Use the
scatterplotmethod from Seaborn to visualize the data. - Save Plot: Save your plot using the
savefigmethod from Matplotlib. - Convert to PDF: Use the
ImageToPdfandSaveAsmethods from IronPDF to convert the image to a PDF. - Display Plot: Display the scatter plot using
plt.show().
Output
IronPDF License
IronPDF for Python license key allows users to test its comprehensive features before purchasing. After the trial license period, developers can purchase a perpetual license that fits their project needs.
Place the License Key at the start of the script before using the IronPDF package:
from ironpdf import *
# Apply your license key
License.LicenseKey = "key"
from ironpdf import *
# Apply your license key
License.LicenseKey = "key"Conclusion
Seaborn is widely recognized for its capabilities in data visualization. Its high-level interface, integration with Pandas, and beautiful default styles make it an excellent choice for creating informative and attractive statistical graphics. Whether you are a beginner or an experienced data scientist, Seaborn can help you explore and understand your data more effectively. On the other hand, IronPDF is a popular library for PDF generation and manipulation in .NET environments, known for its robust feature set and ease of use, helps to document and archive the results from Seaborn in a standard way to save them as PDFs. Both libraries add excellent skills to developers to develop and archive modern data visualization results.