Appmetrics C#(對於開發者的運行原理)
AppMetrics C# 是一個強大的工具,專為簡化應用程式監控和性能分析而設計。 透過AppMetrics抽象化,它簡化了追踪應用程式各種方面的複雜性。 無論您使用的是.NET Core還是.NET Framework,這個.NET程式庫都能高效地記錄度量型別。 您可以檢索度量並利用AppMetrics支持的度量型別以獲得全面的洞察。
.NET 程式庫支持檢索度量並允許您在指定的間隔內刷新度量,確保及時收集資料。 它還提供了一種擴展方法,提供了增強靈活性的擴展點。 作為跨平臺解決方案,AppMetrics適合於不同的環境,並確保一致的性能監控。
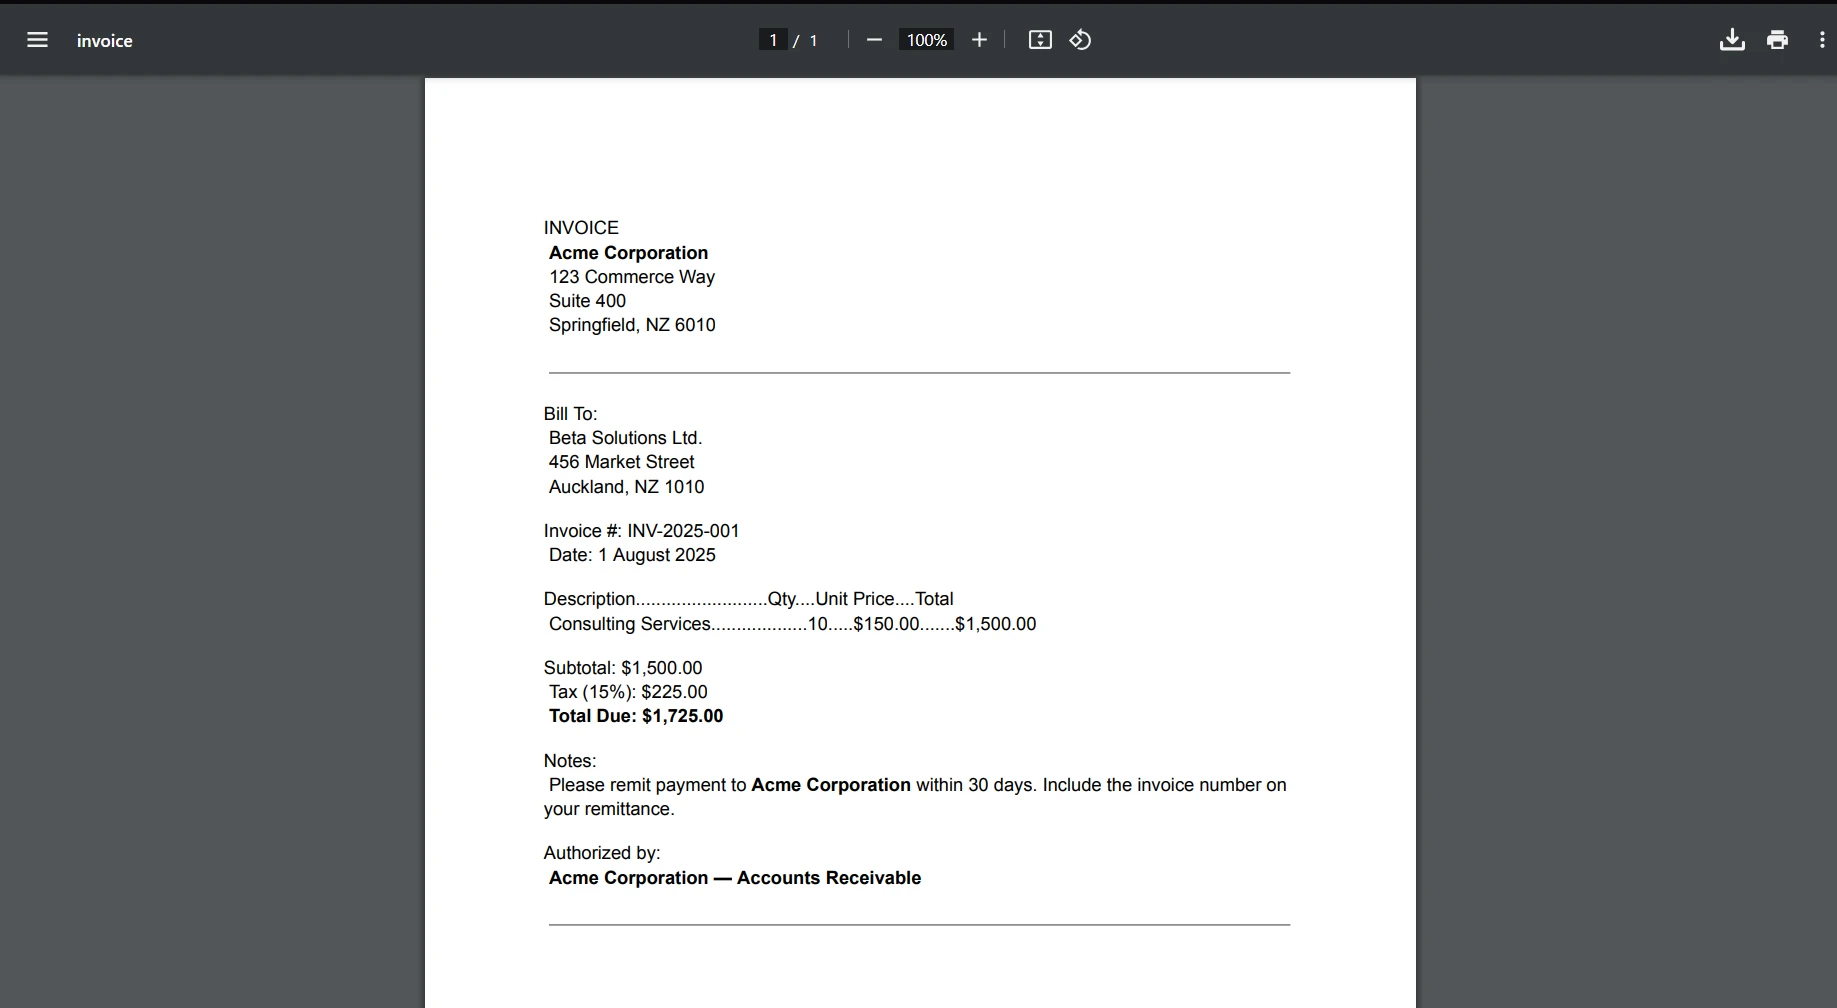
IronPDF: C#開發者的高級PDF程式庫 是另一個C#開發者必備的程式庫,特別是在處理PDF文件時。 它可以直接在.NET Core應用程式中建立、編輯和提取PDF文件。 這在您需要從應用程式中生成報告、發票或其他任何PDF格式文件的情境中特別有用。
開始使用AppMetrics
要將跨平臺AppMetrics整合到您的.NET專案中,請先安裝AppMetrics程式庫。 您可以使用NuGet套件,.NET的套件管理工具來做到這一點。 在您的專案中,在NuGet套件管理主控台中運行以下命令:
Install-Package App.Metrics.AspNetCore
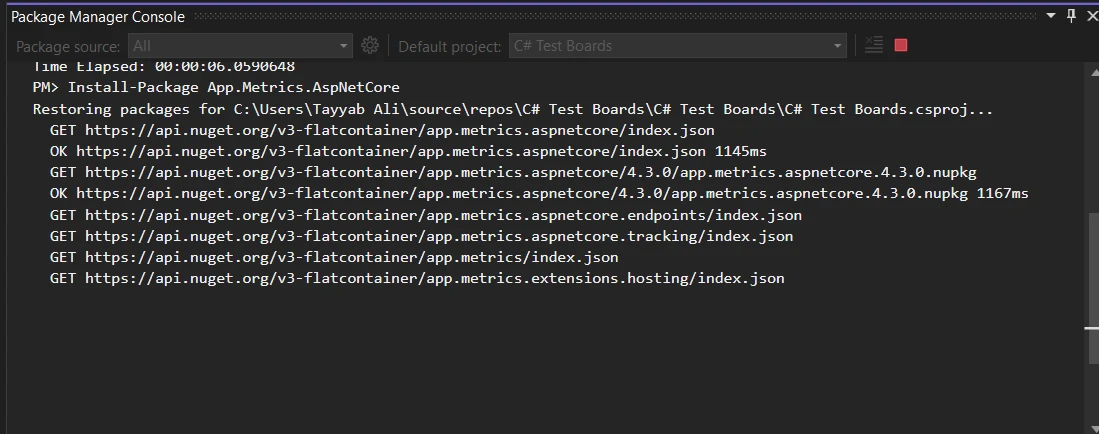
此命令會將所有必要的依賴項新增到您的專案中,使您可以開始配置AppMetrics。
基本程式碼範例:監控HTTP請求
這是如何使用AppMetrics在您的.NET應用程式中設置HTTP請求基本監控的方法。 首先,在您的Startup.cs檔案中構建度量。在ConfigureServices方法中新增以下程式碼:
public void ConfigureServices(IServiceCollection services)
{
    services.AddMetrics(); // Add basic metrics services
    services.AddMetricsTrackingMiddleware(); // Enable middleware for tracking
    services.AddMetricsEndpoints(); // Add endpoints for metrics exposure
}
public void ConfigureServices(IServiceCollection services)
{
services.AddMetrics(); // Add basic metrics services
services.AddMetricsTrackingMiddleware(); // Enable middleware for tracking
services.AddMetricsEndpoints(); // Add endpoints for metrics exposure
}Public Sub ConfigureServices(ByVal services As IServiceCollection)
services.AddMetrics() ' Add basic metrics services
services.AddMetricsTrackingMiddleware() ' Enable middleware for tracking
services.AddMetricsEndpoints() ' Add endpoints for metrics exposure
End Sub接下來,在同一檔案的Configure方法中,確保您新增了AppMetrics中介層來處理監控:
public void Configure(IApplicationBuilder app, IWebHostEnvironment env)
{
    app.UseMetricsAllMiddleware(); // Register the middleware to capture all metrics
}
public void Configure(IApplicationBuilder app, IWebHostEnvironment env)
{
app.UseMetricsAllMiddleware(); // Register the middleware to capture all metrics
}Public Sub Configure(ByVal app As IApplicationBuilder, ByVal env As IWebHostEnvironment)
app.UseMetricsAllMiddleware() ' Register the middleware to capture all metrics
End Sub此設置會自動開始捕獲有關進入您應用程式的HTTP請求的度量,例如請求計數、請求持續時間和錯誤率。
實現AppMetrics的功能
記錄自定義度量
要在您的應用程式中建立和記錄自定義度量或測量事物,AppMetrics提供了一種靈活的方法來定義需要追踪的內容。 這是一個記錄簡單計數器以追踪使用者登入的範例:
public class LoginTracker
{
    private readonly IMetrics _metrics;

    public LoginTracker(IMetrics metrics)
    {
        _metrics = metrics;
    }

    public void TrackLogin(string userId)
    {
        // Increment login counter for the specified user ID
        _metrics.Measure.Counter.Increment(MetricsRegistry.Logins, new MetricTags("UserId", userId));
    }
}
public class LoginTracker
{
private readonly IMetrics _metrics;
public LoginTracker(IMetrics metrics)
{
_metrics = metrics;
}
public void TrackLogin(string userId)
{
// Increment login counter for the specified user ID
_metrics.Measure.Counter.Increment(MetricsRegistry.Logins, new MetricTags("UserId", userId));
}
}Public Class LoginTracker
Private ReadOnly _metrics As IMetrics
Public Sub New(ByVal metrics As IMetrics)
_metrics = metrics
End Sub
Public Sub TrackLogin(ByVal userId As String)
' Increment login counter for the specified user ID
_metrics.Measure.Counter.Increment(MetricsRegistry.Logins, New MetricTags("UserId", userId))
End Sub
End Class在此程式碼中,每次調用TrackLogin時,登入計數器將增加指定的使用者ID。
測量應用程式性能
AppMetrics也可以用來測量應用程式性能。 例如,您可以使用計時器來追踪特定方法的持續時間:
public void ProcessData()
{
    // Measure time taken by the database query process
    using (_metrics.Measure.Timer.Time(MetricsRegistry.DatabaseQueryTimer))
    {
        // Code to execute a database query goes here
    }
}
public void ProcessData()
{
// Measure time taken by the database query process
using (_metrics.Measure.Timer.Time(MetricsRegistry.DatabaseQueryTimer))
{
// Code to execute a database query goes here
}
}Public Sub ProcessData()
' Measure time taken by the database query process
Using _metrics.Measure.Timer.Time(MetricsRegistry.DatabaseQueryTimer)
' Code to execute a database query goes here
End Using
End Sub此計時器記錄了執行ProcessData方法所花費的時間,提供了對資料庫查詢性能的洞察。
向儀表板報告度量
為了可視化和監控您的各種型別度量,AppMetrics可以將資料報告到不同的儀表板。 這是如何配置報告到InfluxDB儀表板的方法:
public void ConfigureServices(IServiceCollection services)
{
    services.AddMetricsReportingHostedService();
    services.AddMetrics(builder =>
    {
        builder.Report.ToInfluxDb(options =>
        {
            options.InfluxDb.BaseUri = new Uri("http://your-influxdb-server"); // Configure InfluxDB server URI
            options.InfluxDb.Database = "appmetricsdb"; // Specify the database name
            options.InfluxDb.UserName = "user"; // Set database username
            options.InfluxDb.Password = "password"; // Set database password
            options.HttpPolicy.BackoffPeriod = TimeSpan.FromSeconds(30); // Set backoff period
            options.HttpPolicy.FailuresBeforeBackoff = 5; // Set failure count before backoff
            options.HttpPolicy.Timeout = TimeSpan.FromSeconds(10); // Set HTTP timeout duration
            options.FlushInterval = TimeSpan.FromSeconds(5); // Set interval for reporting metrics
        });
    });
}
public void ConfigureServices(IServiceCollection services)
{
services.AddMetricsReportingHostedService();
services.AddMetrics(builder =>
{
builder.Report.ToInfluxDb(options =>
{
options.InfluxDb.BaseUri = new Uri("http://your-influxdb-server"); // Configure InfluxDB server URI
options.InfluxDb.Database = "appmetricsdb"; // Specify the database name
options.InfluxDb.UserName = "user"; // Set database username
options.InfluxDb.Password = "password"; // Set database password
options.HttpPolicy.BackoffPeriod = TimeSpan.FromSeconds(30); // Set backoff period
options.HttpPolicy.FailuresBeforeBackoff = 5; // Set failure count before backoff
options.HttpPolicy.Timeout = TimeSpan.FromSeconds(10); // Set HTTP timeout duration
options.FlushInterval = TimeSpan.FromSeconds(5); // Set interval for reporting metrics
});
});
}Public Sub ConfigureServices(ByVal services As IServiceCollection)
services.AddMetricsReportingHostedService()
services.AddMetrics(Sub(builder)
builder.Report.ToInfluxDb(Sub(options)
options.InfluxDb.BaseUri = New Uri("http://your-influxdb-server") ' Configure InfluxDB server URI
options.InfluxDb.Database = "appmetricsdb" ' Specify the database name
options.InfluxDb.UserName = "user" ' Set database username
options.InfluxDb.Password = "password" ' Set database password
options.HttpPolicy.BackoffPeriod = TimeSpan.FromSeconds(30) ' Set backoff period
options.HttpPolicy.FailuresBeforeBackoff = 5 ' Set failure count before backoff
options.HttpPolicy.Timeout = TimeSpan.FromSeconds(10) ' Set HTTP timeout duration
options.FlushInterval = TimeSpan.FromSeconds(5) ' Set interval for reporting metrics
End Sub)
End Sub)
End Sub追踪記憶體使用情況
監控系統記憶體使用情況對性能調整至關重要。 這是如何追踪空閑記憶體的方法:
public void CheckSystemMemory()
{
    var freeMemory = GC.GetTotalMemory(false); // Get total free memory
    _metrics.Measure.Gauge.SetValue(MetricsRegistry.FreeMemory, freeMemory); // Set gauge to measure free memory
}
public void CheckSystemMemory()
{
var freeMemory = GC.GetTotalMemory(false); // Get total free memory
_metrics.Measure.Gauge.SetValue(MetricsRegistry.FreeMemory, freeMemory); // Set gauge to measure free memory
}Public Sub CheckSystemMemory()
Dim freeMemory = GC.GetTotalMemory(False) ' Get total free memory
_metrics.Measure.Gauge.SetValue(MetricsRegistry.FreeMemory, freeMemory) ' Set gauge to measure free memory
End Sub此計量器測量您的應用程式可用的空閑記憶體,幫助您了解記憶體消耗模式。
在指定間隔處理度量
AppMetrics可以配置為在指定的間隔處理度量集合。 這有助於在不過於頻繁地記錄資料的情況下維持性能:
public void ConfigureScheduledReporting(IApplicationBuilder app)
{
    var metrics = app.ApplicationServices.GetService<IMetricsRoot>(); // Retrieve the IMetricsRoot instance
    var scheduler = new AppMetricsTaskScheduler(
        TimeSpan.FromSeconds(60), // Set the interval for metrics collection
        async () =>
        {
            await Task.WhenAll(metrics.ReportRunner.RunAllAsync()); // Run all reports asynchronously
        });
    scheduler.Start(); // Start the scheduler
}
public void ConfigureScheduledReporting(IApplicationBuilder app)
{
var metrics = app.ApplicationServices.GetService<IMetricsRoot>(); // Retrieve the IMetricsRoot instance
var scheduler = new AppMetricsTaskScheduler(
TimeSpan.FromSeconds(60), // Set the interval for metrics collection
async () =>
{
await Task.WhenAll(metrics.ReportRunner.RunAllAsync()); // Run all reports asynchronously
});
scheduler.Start(); // Start the scheduler
}Public Sub ConfigureScheduledReporting(ByVal app As IApplicationBuilder)
Dim metrics = app.ApplicationServices.GetService(Of IMetricsRoot)() ' Retrieve the IMetricsRoot instance
Dim scheduler = New AppMetricsTaskScheduler(TimeSpan.FromSeconds(60), Async Sub()
Await Task.WhenAll(metrics.ReportRunner.RunAllAsync()) ' Run all reports asynchronously
End Sub)
scheduler.Start() ' Start the scheduler
End Sub此配置設置為每60秒報告度量,確保一致的性能監控並且不會因為持續的資料記錄而使系統過載。
整合AppMetrics與IronPDF
當在您的C#應用程式中使用度量和PDF生成時,將AppMetrics C#與IronPDF結合起來非常有用。 此整合允許您直接從您的度量資料中生成PDF格式的報告,這對於性能評審、客戶演示甚至內部審計都很有幫助。
介紹IronPDF
IronPDF是一個全面的程式庫,可以讓開發者使用C#建立、讀取和編輯PDF文件。 IronPDF的與眾不同之處在於其將HTML轉換為PDF的能力,這對基於Web的報告生成特別有價值。 此功能確保您的報告的視覺效果得以保留,提供從網頁到列印形式的高保真度。
Use Case of Merging IronPDF with AppMetrics C
考慮一個需要向利益相關者提供應用程式的每月性能報告的情境。 這些報告包含度量,如響應時間、錯誤率、使用者會話等。 使用開源的AppMetrics C#,您可以順利地捕獲這些度量。 通過將此功能與IronPDF結合起來,您可以自動生成這些度量的整齊格式的PDF文件並分發。
用例的程式碼範例
以下是如何實現這一點的完整範例。 此範例假設您已經在您的專案中設置好了IronPDF和AppMetrics C#。
using App.Metrics;
using App.Metrics.Formatters.Prometheus;
using IronPdf;
public class MetricsToPdfConverter
{
    private readonly IMetricsRoot _metrics;

    public MetricsToPdfConverter(IMetricsRoot metrics)
    {
        _metrics = metrics;
    }

    public void GeneratePdfReport(string outputPath)
    {
        // Step 1: Capture the metrics snapshot
        var metricsData = _metrics.Snapshot.Get();
        var formatter = new MetricsPrometheusTextOutputFormatter();
        using var stream = new MemoryStream();
        formatter.WriteAsync(stream, metricsData).Wait();

        // Step 2: Convert the metrics snapshot to string format
        stream.Position = 0;
        var reader = new StreamReader(stream);
        var metricsText = reader.ReadToEnd();

        // Step 3: Use IronPDF to convert the metrics text to a PDF document
        var renderer = new ChromePdfRenderer();
        var pdf = renderer.RenderHtmlAsPdf("<h1> Metrics Report </h1> <pre>" + metricsText + "</pre>");

        // Step 4: Save the PDF document
        pdf.SaveAs(outputPath);
    }
}

// Usage
var metrics = new MetricsBuilder().Build();
var pdfConverter = new MetricsToPdfConverter(metrics);
pdfConverter.GeneratePdfReport("MonthlyPerformanceReport.pdf");
using App.Metrics;
using App.Metrics.Formatters.Prometheus;
using IronPdf;
public class MetricsToPdfConverter
{
private readonly IMetricsRoot _metrics;
public MetricsToPdfConverter(IMetricsRoot metrics)
{
_metrics = metrics;
}
public void GeneratePdfReport(string outputPath)
{
// Step 1: Capture the metrics snapshot
var metricsData = _metrics.Snapshot.Get();
var formatter = new MetricsPrometheusTextOutputFormatter();
using var stream = new MemoryStream();
formatter.WriteAsync(stream, metricsData).Wait();
// Step 2: Convert the metrics snapshot to string format
stream.Position = 0;
var reader = new StreamReader(stream);
var metricsText = reader.ReadToEnd();
// Step 3: Use IronPDF to convert the metrics text to a PDF document
var renderer = new ChromePdfRenderer();
var pdf = renderer.RenderHtmlAsPdf("<h1> Metrics Report </h1> <pre>" + metricsText + "</pre>");
// Step 4: Save the PDF document
pdf.SaveAs(outputPath);
}
}
// Usage
var metrics = new MetricsBuilder().Build();
var pdfConverter = new MetricsToPdfConverter(metrics);
pdfConverter.GeneratePdfReport("MonthlyPerformanceReport.pdf");Imports App.Metrics
Imports App.Metrics.Formatters.Prometheus
Imports IronPdf
Public Class MetricsToPdfConverter
Private ReadOnly _metrics As IMetricsRoot
Public Sub New(ByVal metrics As IMetricsRoot)
_metrics = metrics
End Sub
Public Sub GeneratePdfReport(ByVal outputPath As String)
' Step 1: Capture the metrics snapshot
Dim metricsData = _metrics.Snapshot.Get()
Dim formatter = New MetricsPrometheusTextOutputFormatter()
Dim stream = New MemoryStream()
formatter.WriteAsync(stream, metricsData).Wait()
' Step 2: Convert the metrics snapshot to string format
stream.Position = 0
Dim reader = New StreamReader(stream)
Dim metricsText = reader.ReadToEnd()
' Step 3: Use IronPDF to convert the metrics text to a PDF document
Dim renderer = New ChromePdfRenderer()
Dim pdf = renderer.RenderHtmlAsPdf("<h1> Metrics Report </h1> <pre>" & metricsText & "</pre>")
' Step 4: Save the PDF document
pdf.SaveAs(outputPath)
End Sub
End Class
' Usage
Private metrics = (New MetricsBuilder()).Build()
Private pdfConverter = New MetricsToPdfConverter(metrics)
pdfConverter.GeneratePdfReport("MonthlyPerformanceReport.pdf")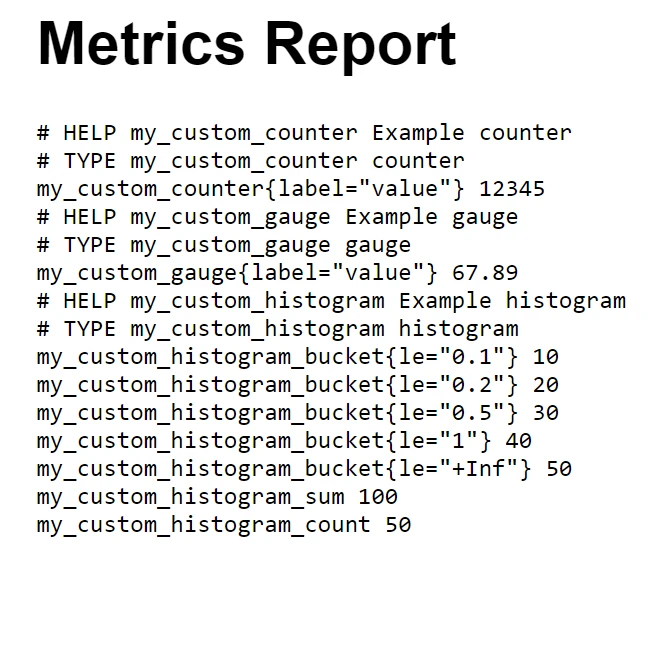
此整合不僅自動化了報告生成的過程,還確保報告易於閱讀且專業格式化,非常適合任何利益相關者會議或存檔用途。
結論
總之,在您的.NET專案中將AppMetrics C#與IronPDF結合提供了一個強大的解決方案,既可以監控應用程式性能,又可以生成高品質的PDF報告。 此整合讓您可以從使用AppMetrics捕獲詳細性能資料中無縫過渡到使用IronPDF以清晰、專業的格式呈現。
IronPDF對於想在其應用程式中處理PDF文件的C#開發者特別有價值。 它簡化了PDF文件的建立和操作,並提供了直接將HTML轉換為PDF的獨特能力。 如果您考慮將IronPDF整合到您的專案中,他們提供IronPDF免費試用以助您入門,授權從$999開始,提供一種經濟有效地增強文件處理能力的方式。
常見問題
什麼是AppMetrics C#,以及它如何為開發者帶來好處?
AppMetrics C#是一個為應用程式監控和效能分析而設計的工具,允許開發者在.NET Core和.NET Framework中有效地追蹤和檢索各種應用程式度量。
如何將AppMetrics整合到.NET專案?
您可以使用NuGet套件管理器將AppMetrics整合到您的.NET專案中,使用命令:Install-Package App.Metrics.AspNetCore。
IronPDF在從AppMetrics資料生成報告中的角色是什麼?
IronPDF可以用來從AppMetrics資料生成綜合的PDF報告,藉由將HTML格式的度量資料轉換為高品質的PDF,非常適合效能評估和簡報。
如何使用AppMetrics追蹤自定義度量?
AppMetrics允許您定義和追蹤自定義度量,例如使用者活動或特定交易時間,以便根據應用程式的需求進行詳細的效能分析。
有哪些選擇可用於可視化AppMetrics資料?
AppMetrics支援報告到各種儀表板,如InfluxDB,允許開發者有效地可視化和監控度量資料。
開發者如何使用AppMetrics優化應用程式效能?
開發者可以通過使用AppMetrics監控記憶體使用情況和管理排程的度量,確保有效的資源管理和應用程式響應。
使用IronPDF生成PDF報告的好處是什麼?
使用IronPDF從AppMetrics資料生成PDF報告的優勢在於可以建立專業且易於閱讀的文件,增強與利益相關者的溝通。
IronPDF有免費試用版嗎?
有的,IronPDF提供免費試用版,允許開發者在購買前探索其PDF生成功能。