Appmetrics C# (개발자를 위한 작동 방식)
AppMetrics C#는 응용 프로그램 모니터링 및 성능 분석을 간소화하기 위해 설계된 강력한 도구입니다. AppMetrics 추상은 응용 프로그램의 다양한 측면을 추적하는 데 관련된 복잡성을 단순화합니다. .NET Core 또는 .NET Framework를 사용하는 경우 이 .NET 라이브러리는 메트릭 유형을 효율적으로 기록할 수 있도록 합니다. AppMetrics에서 지원하는 메트릭 유형을 사용하여 포괄적인 통찰을 얻을 수 있습니다.
.NET 라이브러리는 메트릭을 검색하고, 지정된 간격으로 메트릭을 플러시하여 데이터 수집을 적시에 보장합니다. 또한 응용 프로그램 성능을 향상시키기 위해 확장성 지점을 제공하는 확장 메소드를 제공합니다. 크로스 플랫폼 솔루션으로써 AppMetrics는 다양한 환경에 적합하며 일관된 성능 모니터링을 보장합니다.
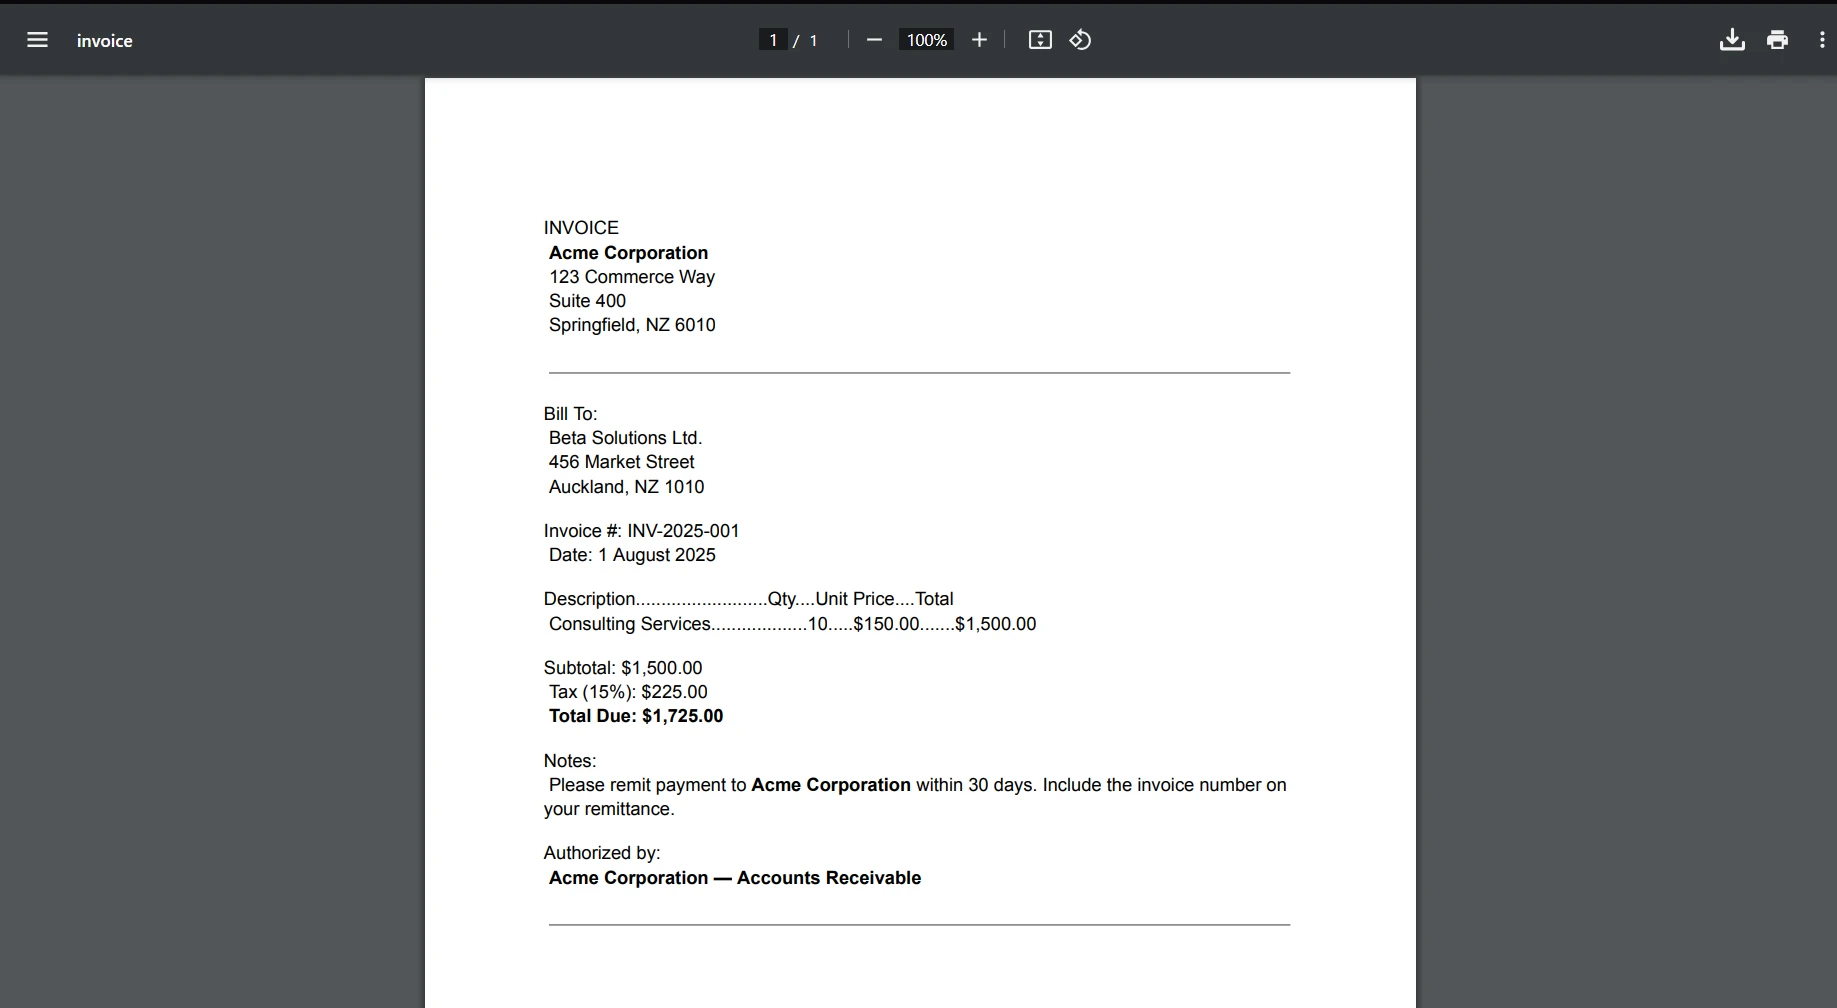
IronPDF: C# 개발자를 위한 고급 PDF 라이브러리는 특히 PDF 문서를 다룰 때 C# 개발자에게 필수적인 라이브러리입니다. 이는 .NET Core 응용 프로그램 내에서 직접 PDF 파일을 생성, 편집 및 추출할 수 있도록 합니다. 이는 응용 프로그램에서 보고서, 송장 또는 다른 문서를 PDF 형식으로 생성해야 하는 시나리오에서 특히 유용할 수 있습니다.
AppMetrics 시작하기
크로스 플랫폼 AppMetrics를 .NET 프로젝트에 통합하려면 AppMetrics 라이브러리를 설치하는 것부터 시작합니다. 이를 .NET의 패키지 관리자 인 NuGet 패키지를 사용하여 수행할 수 있습니다. 프로젝트에서 다음 명령을 NuGet Package Manager Console에서 실행하십시오:
Install-Package App.Metrics.AspNetCore
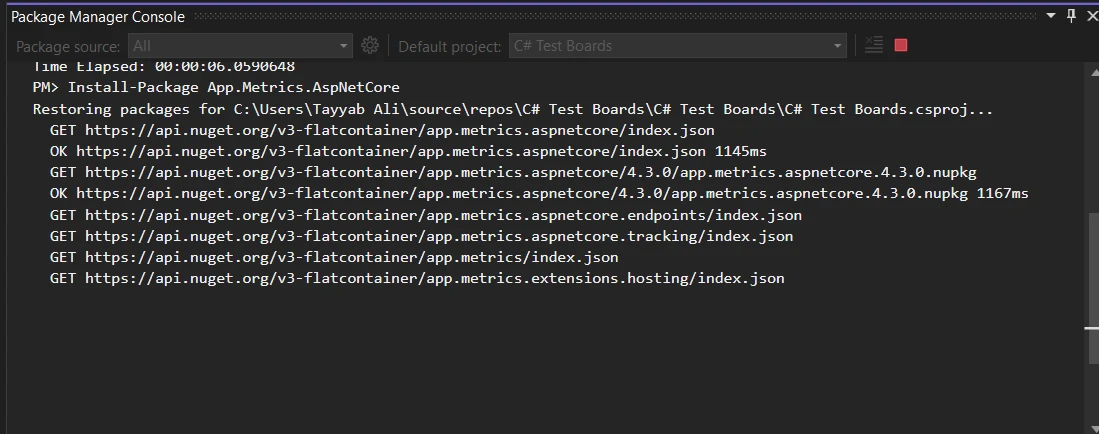
이 명령은 필요한 모든 종속성을 프로젝트에 추가하여 AppMetrics를 구성하는 데 필요한 정보를 제공합니다.
기본 코드 예제: HTTP 요청 모니터링
여기에서 AppMetrics를 사용하여 .NET 응용 프로그램에서 HTTP 요청을 기본 모니터링하는 방법을 설명합니다. 먼저, Startup.cs 파일에서 메트릭을 빌드하십시오. ConfigureServices 메소드에 다음 코드를 추가하십시오.
public void ConfigureServices(IServiceCollection services)
{
    services.AddMetrics(); // Add basic metrics services
    services.AddMetricsTrackingMiddleware(); // Enable middleware for tracking
    services.AddMetricsEndpoints(); // Add endpoints for metrics exposure
}
public void ConfigureServices(IServiceCollection services)
{
services.AddMetrics(); // Add basic metrics services
services.AddMetricsTrackingMiddleware(); // Enable middleware for tracking
services.AddMetricsEndpoints(); // Add endpoints for metrics exposure
}Public Sub ConfigureServices(ByVal services As IServiceCollection)
services.AddMetrics() ' Add basic metrics services
services.AddMetricsTrackingMiddleware() ' Enable middleware for tracking
services.AddMetricsEndpoints() ' Add endpoints for metrics exposure
End Sub다음으로, 동일한 파일의 Configure 메소드에 Monitoring을 처리하기 위해 AppMetrics 미들웨어를 추가했는지 확인하십시오.
public void Configure(IApplicationBuilder app, IWebHostEnvironment env)
{
    app.UseMetricsAllMiddleware(); // Register the middleware to capture all metrics
}
public void Configure(IApplicationBuilder app, IWebHostEnvironment env)
{
app.UseMetricsAllMiddleware(); // Register the middleware to capture all metrics
}Public Sub Configure(ByVal app As IApplicationBuilder, ByVal env As IWebHostEnvironment)
app.UseMetricsAllMiddleware() ' Register the middleware to capture all metrics
End Sub이 설정은 자동으로 응용 프로그램에 대한 수신 HTTP 요청에 대한 메트릭(요청 수, 요청 지속 시간, 오류 비율 등)을 캡처하기 시작합니다.
AppMetrics 기능 구현
사용자 정의 메트릭 기록
응용 프로그램에서 사용자 정의 메트릭을 생성하고 기록하거나 측정하기 위해, AppMetrics는 추적 필요 사항을 정의하는 유연한 방법을 제공합니다. 여기에 사용자 로그인 추적을 위한 간단한 카운터를 기록하는 예시가 있습니다:
public class LoginTracker
{
    private readonly IMetrics _metrics;

    public LoginTracker(IMetrics metrics)
    {
        _metrics = metrics;
    }

    public void TrackLogin(string userId)
    {
        // Increment login counter for the specified user ID
        _metrics.Measure.Counter.Increment(MetricsRegistry.Logins, new MetricTags("UserId", userId));
    }
}
public class LoginTracker
{
private readonly IMetrics _metrics;
public LoginTracker(IMetrics metrics)
{
_metrics = metrics;
}
public void TrackLogin(string userId)
{
// Increment login counter for the specified user ID
_metrics.Measure.Counter.Increment(MetricsRegistry.Logins, new MetricTags("UserId", userId));
}
}Public Class LoginTracker
Private ReadOnly _metrics As IMetrics
Public Sub New(ByVal metrics As IMetrics)
_metrics = metrics
End Sub
Public Sub TrackLogin(ByVal userId As String)
' Increment login counter for the specified user ID
_metrics.Measure.Counter.Increment(MetricsRegistry.Logins, New MetricTags("UserId", userId))
End Sub
End Class이 코드에서는 TrackLogin이 호출될 때마다 지정된 사용자 ID의 로그인 카운터가 증가합니다.
응용 프로그램 성능 측정
AppMetrics는 응용 프로그램 성능을 측정하는 데에도 사용할 수 있습니다. 예를 들어, 타이머를 사용하여 특정 메소드의 지속 시간을 추적할 수 있습니다.
public void ProcessData()
{
    // Measure time taken by the database query process
    using (_metrics.Measure.Timer.Time(MetricsRegistry.DatabaseQueryTimer))
    {
        // Code to execute a database query goes here
    }
}
public void ProcessData()
{
// Measure time taken by the database query process
using (_metrics.Measure.Timer.Time(MetricsRegistry.DatabaseQueryTimer))
{
// Code to execute a database query goes here
}
}Public Sub ProcessData()
' Measure time taken by the database query process
Using _metrics.Measure.Timer.Time(MetricsRegistry.DatabaseQueryTimer)
' Code to execute a database query goes here
End Using
End Sub이 타이머는 ProcessData 메소드가 실행되는 데 소요되는 시간을 기록하여 데이터베이스 쿼리의 성능에 대한 통찰을 제공합니다.
대시보드로 메트릭 보고하기
다양한 메트릭 유형을 시각화하고 모니터링하기 위해, AppMetrics는 데이터를 다양한 대시보드에 보고할 수 있습니다. InfluxDB 대시보드에 보고서를 설정하는 방법은 다음과 같습니다:
public void ConfigureServices(IServiceCollection services)
{
    services.AddMetricsReportingHostedService();
    services.AddMetrics(builder =>
    {
        builder.Report.ToInfluxDb(options =>
        {
            options.InfluxDb.BaseUri = new Uri("http://your-influxdb-server"); // Configure InfluxDB server URI
            options.InfluxDb.Database = "appmetricsdb"; // Specify the database name
            options.InfluxDb.UserName = "user"; // Set database username
            options.InfluxDb.Password = "password"; // Set database password
            options.HttpPolicy.BackoffPeriod = TimeSpan.FromSeconds(30); // Set backoff period
            options.HttpPolicy.FailuresBeforeBackoff = 5; // Set failure count before backoff
            options.HttpPolicy.Timeout = TimeSpan.FromSeconds(10); // Set HTTP timeout duration
            options.FlushInterval = TimeSpan.FromSeconds(5); // Set interval for reporting metrics
        });
    });
}
public void ConfigureServices(IServiceCollection services)
{
services.AddMetricsReportingHostedService();
services.AddMetrics(builder =>
{
builder.Report.ToInfluxDb(options =>
{
options.InfluxDb.BaseUri = new Uri("http://your-influxdb-server"); // Configure InfluxDB server URI
options.InfluxDb.Database = "appmetricsdb"; // Specify the database name
options.InfluxDb.UserName = "user"; // Set database username
options.InfluxDb.Password = "password"; // Set database password
options.HttpPolicy.BackoffPeriod = TimeSpan.FromSeconds(30); // Set backoff period
options.HttpPolicy.FailuresBeforeBackoff = 5; // Set failure count before backoff
options.HttpPolicy.Timeout = TimeSpan.FromSeconds(10); // Set HTTP timeout duration
options.FlushInterval = TimeSpan.FromSeconds(5); // Set interval for reporting metrics
});
});
}Public Sub ConfigureServices(ByVal services As IServiceCollection)
services.AddMetricsReportingHostedService()
services.AddMetrics(Sub(builder)
builder.Report.ToInfluxDb(Sub(options)
options.InfluxDb.BaseUri = New Uri("http://your-influxdb-server") ' Configure InfluxDB server URI
options.InfluxDb.Database = "appmetricsdb" ' Specify the database name
options.InfluxDb.UserName = "user" ' Set database username
options.InfluxDb.Password = "password" ' Set database password
options.HttpPolicy.BackoffPeriod = TimeSpan.FromSeconds(30) ' Set backoff period
options.HttpPolicy.FailuresBeforeBackoff = 5 ' Set failure count before backoff
options.HttpPolicy.Timeout = TimeSpan.FromSeconds(10) ' Set HTTP timeout duration
options.FlushInterval = TimeSpan.FromSeconds(5) ' Set interval for reporting metrics
End Sub)
End Sub)
End Sub메모리 사용량 추적
시스템 메모리 사용량 모니터링은 성능 조정에 매우 중요합니다. 여유 메모리를 추적하는 방법은 다음과 같습니다:
public void CheckSystemMemory()
{
    var freeMemory = GC.GetTotalMemory(false); // Get total free memory
    _metrics.Measure.Gauge.SetValue(MetricsRegistry.FreeMemory, freeMemory); // Set gauge to measure free memory
}
public void CheckSystemMemory()
{
var freeMemory = GC.GetTotalMemory(false); // Get total free memory
_metrics.Measure.Gauge.SetValue(MetricsRegistry.FreeMemory, freeMemory); // Set gauge to measure free memory
}Public Sub CheckSystemMemory()
Dim freeMemory = GC.GetTotalMemory(False) ' Get total free memory
_metrics.Measure.Gauge.SetValue(MetricsRegistry.FreeMemory, freeMemory) ' Set gauge to measure free memory
End Sub이 게이지는 애플리케이션에 사용할 수 있는 여유 메모리를 측정하여 메모리 소비 패턴을 이해하는 데 도움이 됩니다.
지정된 간격으로 메트릭 처리
AppMetrics는 지정된 간격으로 메트릭 수집을 처리하도록 설정할 수 있습니다. 이를 통해 데이터 로그를 너무 자주 기록하지 않으면서 성능을 유지할 수 있습니다:
public void ConfigureScheduledReporting(IApplicationBuilder app)
{
    var metrics = app.ApplicationServices.GetService<IMetricsRoot>(); // Retrieve the IMetricsRoot instance
    var scheduler = new AppMetricsTaskScheduler(
        TimeSpan.FromSeconds(60), // Set the interval for metrics collection
        async () =>
        {
            await Task.WhenAll(metrics.ReportRunner.RunAllAsync()); // Run all reports asynchronously
        });
    scheduler.Start(); // Start the scheduler
}
public void ConfigureScheduledReporting(IApplicationBuilder app)
{
var metrics = app.ApplicationServices.GetService<IMetricsRoot>(); // Retrieve the IMetricsRoot instance
var scheduler = new AppMetricsTaskScheduler(
TimeSpan.FromSeconds(60), // Set the interval for metrics collection
async () =>
{
await Task.WhenAll(metrics.ReportRunner.RunAllAsync()); // Run all reports asynchronously
});
scheduler.Start(); // Start the scheduler
}Public Sub ConfigureScheduledReporting(ByVal app As IApplicationBuilder)
Dim metrics = app.ApplicationServices.GetService(Of IMetricsRoot)() ' Retrieve the IMetricsRoot instance
Dim scheduler = New AppMetricsTaskScheduler(TimeSpan.FromSeconds(60), Async Sub()
Await Task.WhenAll(metrics.ReportRunner.RunAllAsync()) ' Run all reports asynchronously
End Sub)
scheduler.Start() ' Start the scheduler
End Sub이 설정은 메트릭을 60초마다 보고하도록 설정하여, 지속적인 데이터 로깅으로 시스템을 과부하시키지 않으면서 일관된 성능 모니터링을 보장합니다.
AppMetrics와 IronPDF 통합
C# 애플리케이션에서 메트릭과 PDF 생성을 다룰 때, AppMetrics C#과 IronPDF를 결합하는 것은 매우 유용할 수 있습니다. 이 통합은 성능 검토, 고객 프레젠테이션, 또는 내부 감사를 위한 PDF 형식의 보고서를 바로 메트릭 데이터에서 생성할 수 있게 해줍니다.
IronPDF 소개
IronPDF는 개발자가 C#을 사용하여 PDF 문서를 생성, 읽고 편집할 수 있게 해주는 종합적인 라이브러리입니다. IronPDF를 돋보이게 하는 점은 HTML을 PDF로 변환하는 기능을 제공한다는 점으로, 웹 기반 보고서 생성에 특히 가치가 있습니다. 이 기능은 보고서의 시각적 측면을 보존하여 웹에서 인쇄 형식까지 높은 충실도를 제공합니다.
Use Case of Merging IronPDF with AppMetrics C
이해관계자에게 애플리케이션의 월간 성능 보고서를 제공해야 하는 시나리오를 고려하세요. 이러한 보고서는 응답 시간, 오류율, 사용자 세션 등과 같은 메트릭을 포함합니다. 오픈 소스 AppMetrics C#을 사용하면 이러한 메트릭을 원활하게 캡처할 수 있습니다. 이 기능을 IronPDF와 결합하여, 깔끔하게 포맷된 PDF 문서로 이러한 메트릭을 자동으로 생성하고 배포할 수 있습니다.
사용 사례의 코드 예제
이것을 구현하는 방법에 대한 완전한 예제가 아래에 있습니다. 이 예제는 프로젝트에 IronPDF와 AppMetrics C#이 이미 설정되어 있다고 가정합니다.
using App.Metrics;
using App.Metrics.Formatters.Prometheus;
using IronPdf;
public class MetricsToPdfConverter
{
    private readonly IMetricsRoot _metrics;

    public MetricsToPdfConverter(IMetricsRoot metrics)
    {
        _metrics = metrics;
    }

    public void GeneratePdfReport(string outputPath)
    {
        // Step 1: Capture the metrics snapshot
        var metricsData = _metrics.Snapshot.Get();
        var formatter = new MetricsPrometheusTextOutputFormatter();
        using var stream = new MemoryStream();
        formatter.WriteAsync(stream, metricsData).Wait();

        // Step 2: Convert the metrics snapshot to string format
        stream.Position = 0;
        var reader = new StreamReader(stream);
        var metricsText = reader.ReadToEnd();

        // Step 3: Use IronPDF to convert the metrics text to a PDF document
        var renderer = new ChromePdfRenderer();
        var pdf = renderer.RenderHtmlAsPdf("<h1> Metrics Report </h1> <pre>" + metricsText + "</pre>");

        // Step 4: Save the PDF document
        pdf.SaveAs(outputPath);
    }
}

// Usage
var metrics = new MetricsBuilder().Build();
var pdfConverter = new MetricsToPdfConverter(metrics);
pdfConverter.GeneratePdfReport("MonthlyPerformanceReport.pdf");
using App.Metrics;
using App.Metrics.Formatters.Prometheus;
using IronPdf;
public class MetricsToPdfConverter
{
private readonly IMetricsRoot _metrics;
public MetricsToPdfConverter(IMetricsRoot metrics)
{
_metrics = metrics;
}
public void GeneratePdfReport(string outputPath)
{
// Step 1: Capture the metrics snapshot
var metricsData = _metrics.Snapshot.Get();
var formatter = new MetricsPrometheusTextOutputFormatter();
using var stream = new MemoryStream();
formatter.WriteAsync(stream, metricsData).Wait();
// Step 2: Convert the metrics snapshot to string format
stream.Position = 0;
var reader = new StreamReader(stream);
var metricsText = reader.ReadToEnd();
// Step 3: Use IronPDF to convert the metrics text to a PDF document
var renderer = new ChromePdfRenderer();
var pdf = renderer.RenderHtmlAsPdf("<h1> Metrics Report </h1> <pre>" + metricsText + "</pre>");
// Step 4: Save the PDF document
pdf.SaveAs(outputPath);
}
}
// Usage
var metrics = new MetricsBuilder().Build();
var pdfConverter = new MetricsToPdfConverter(metrics);
pdfConverter.GeneratePdfReport("MonthlyPerformanceReport.pdf");Imports App.Metrics
Imports App.Metrics.Formatters.Prometheus
Imports IronPdf
Public Class MetricsToPdfConverter
Private ReadOnly _metrics As IMetricsRoot
Public Sub New(ByVal metrics As IMetricsRoot)
_metrics = metrics
End Sub
Public Sub GeneratePdfReport(ByVal outputPath As String)
' Step 1: Capture the metrics snapshot
Dim metricsData = _metrics.Snapshot.Get()
Dim formatter = New MetricsPrometheusTextOutputFormatter()
Dim stream = New MemoryStream()
formatter.WriteAsync(stream, metricsData).Wait()
' Step 2: Convert the metrics snapshot to string format
stream.Position = 0
Dim reader = New StreamReader(stream)
Dim metricsText = reader.ReadToEnd()
' Step 3: Use IronPDF to convert the metrics text to a PDF document
Dim renderer = New ChromePdfRenderer()
Dim pdf = renderer.RenderHtmlAsPdf("<h1> Metrics Report </h1> <pre>" & metricsText & "</pre>")
' Step 4: Save the PDF document
pdf.SaveAs(outputPath)
End Sub
End Class
' Usage
Private metrics = (New MetricsBuilder()).Build()
Private pdfConverter = New MetricsToPdfConverter(metrics)
pdfConverter.GeneratePdfReport("MonthlyPerformanceReport.pdf")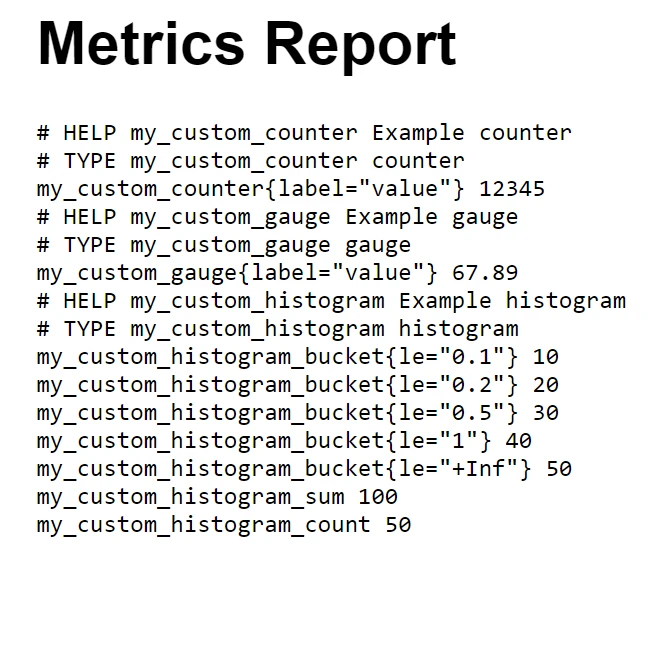
이 통합은 보고서 생성 프로세스를 자동화할 뿐만 아니라, 보고서가 쉽게 읽을 수 있고 전문적으로 포맷될 수 있도록 하여 모든 이해관계자 회의나 기록 보관용으로 적합합니다.
결론
결론적으로, .NET 프로젝트에서 AppMetrics C#과 IronPDF를 결합하는 것은 애플리케이션 성능을 모니터링하고 고품질 PDF 보고서를 생성하는 데 강력한 솔루션을 제공합니다. 이 통합은 AppMetrics로 자세한 성능 데이터를 캡처하는 과정에서 IronPDF를 사용하여 명확하고 전문적인 형식으로 제시할 수 있게 합니다.
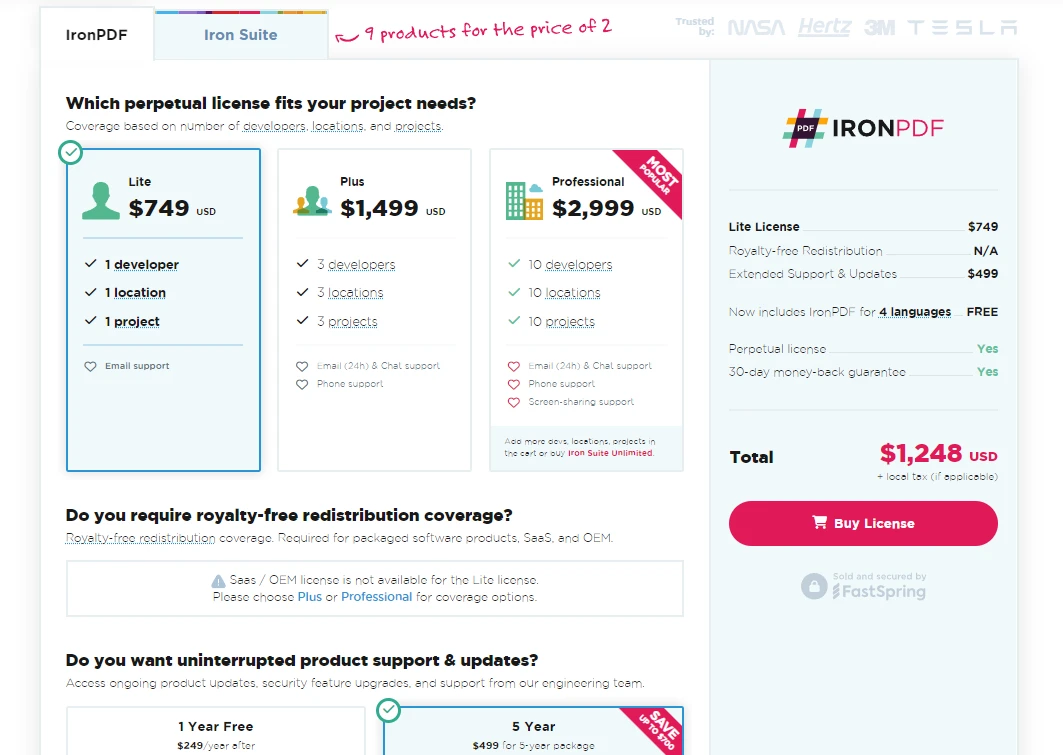
IronPDF는 특히 C# 개발자가 애플리케이션 내에서 PDF 파일을 다루기 위해 유용합니다. 이 라이브러리는 PDF 문서를 쉽게 생성하고 조작할 수 있게 해주며 HTML을 직접 PDF로 변환하는 독특한 기능을 제공합니다. IronPDF를 프로젝트에 도입할 계획이라면, 시작할 수 있도록 IronPDF 무료 체험을 제공하며, 라이선스는 $999에서 시작하여 문서 처리 능력을 향상시킬 수 있는 비용 효과적인 방법을 제공합니다.
자주 묻는 질문
AppMetrics C#은 무엇이며 개발자에게 어떤 이점이 있습니까?
AppMetrics C#은 애플리케이션 모니터링 및 성능 분석을 위해 설계된 도구로, 개발자가 .NET Core 및 .NET Framework에서 다양한 애플리케이션 메트릭을 효율적으로 추적하고 검색할 수 있게 해줍니다.
AppMetrics를 .NET 프로젝트에 통합하려면 어떻게 해야 합니까?
NuGet 패키지 관리자를 사용하여 Install-Package App.Metrics.AspNetCore 명령을 통해 .NET 프로젝트에 AppMetrics를 통합할 수 있습니다.
AppMetrics 데이터에서 IronPDF의 역할은 무엇입니까?
IronPDF는 HTML 형식의 메트릭 데이터를 고품질 PDF로 변환하여 AppMetrics 데이터로부터 포괄적인 PDF 보고서를 생성할 수 있으며, 이는 성능 검토 및 프레젠테이션에 이상적입니다.
AppMetrics를 사용하여 사용자 정의 메트릭을 어떻게 추적할 수 있습니까?
AppMetrics는 사용자 활동이나 특정 거래 시간과 같은 사용자 정의 메트릭을 정의하고 추적할 수 있어, 애플리케이션의 필요에 맞춘 상세한 성능 분석이 가능합니다.
AppMetrics 데이터를 시각화할 수 있는 옵션은 무엇이 있습니까?
AppMetrics는 InfluxDB와 같은 다양한 대시보드에 보고서를 지원하여, 개발자가 메트릭 데이터를 효과적으로 시각화하고 모니터링할 수 있게 합니다.
개발자가 AppMetrics를 사용하여 애플리케이션 성능을 최적화할 수 있는 방법은 무엇입니까?
개발자는 AppMetrics를 사용하여 메모리 사용량을 모니터링하고 예약된 메트릭을 처리하여 효율적인 리소스 관리와 애플리케이션 응답성을 보장함으로써 성능을 최적화할 수 있습니다.
IronPDF를 사용하여 PDF 보고서를 생성하는 이점은 무엇입니까?
IronPDF를 사용하여 AppMetrics 데이터로부터 PDF 보고서를 생성하면 전문적이고 쉽게 읽을 수 있는 문서를 생성할 수 있어, 이해관계자와의 소통을 향상시킵니다.
IronPDF 무료 체험판이 있나요?
네, IronPDF는 무료 체험판을 제공하여 개발자가 구매 전 PDF 생성 기능을 탐색할 수 있게 합니다.