NPlot C#(開發者的工作原理)
本教學專為熱衷於探索整合兩個強大程式庫的初學者所設計:NPlot 和 IronPDF。 它們共同組成了一個強大的工具包,用於在 C# 應用程式中建立和匯出圖表。
NPlot 是 .NET Framework 中的多用途圖表庫,是產生各種圖表和圖形的理想工具。 從簡單的線圖到複雜的散點圖,無論您是處理小型資料集或超大型資料集,NPlot 都能出色地顯示基於樣本的資料並產生動態圖表。
IronPDF 與 NPlot 相輔相成,可將這些圖表轉換成 PDF 文件。 無論您處理的是 HTML 電子郵件內容或特定的繪圖類,IronPDF 都能將它們渲染成高品質的 PDF。
此功能對於需要產生報告或記錄分析資料的應用程式特別有用。
開始使用 NPlot
.NET Framework 中的 NPlot 入門
NPlot 是專為 .NET Framework 設計的動態圖表庫,可滿足廣泛的資料可視化需求。 無論您是在開發桌面應用程式或網頁型解決方案,NPlot 都能提供圖形化、清晰且有效地表達資料的功能。
在您的 C# 專案中安裝 NPlot
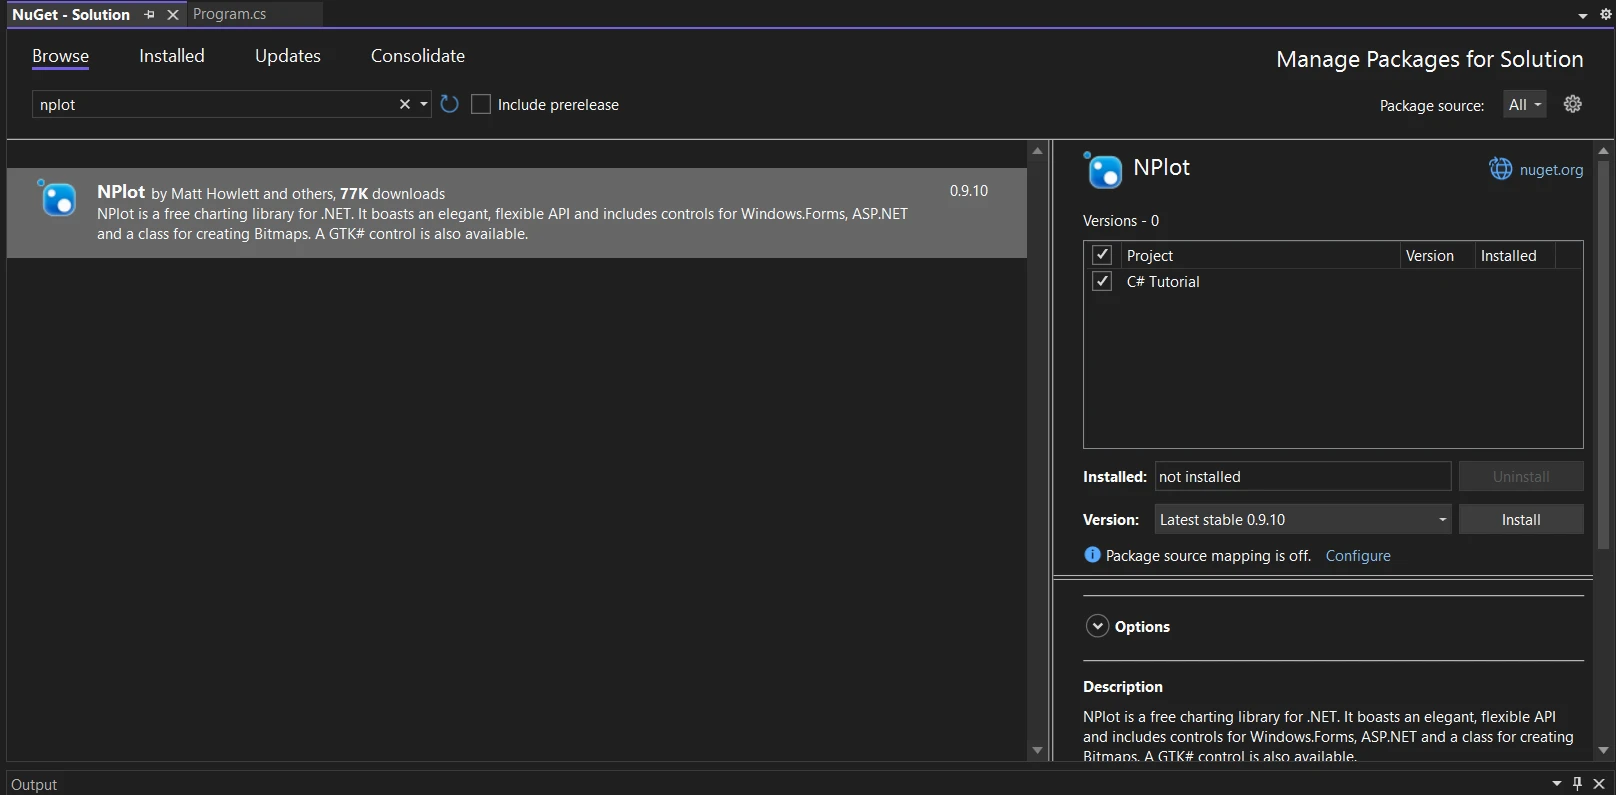
要開始在 C# 專案中使用 NPlot,您需要先安裝它。 以下是如何輕鬆將 NPlot 加入您的應用程式:
使用 NuGet 套件管理員:
1.在 Visual Studio 中,前往"工具">"NuGet 套件管理員">"管理解決方案的 NuGet 套件..."。 2.搜尋"NPlot"並安裝到您的專案中。
使用 NPlot 的第一步
安裝 NPlot 後,您就可以開始建立圖表。 NPlot 的易用性使其非常適合初學者,只需幾行程式碼即可建立圖形。
建立基本圖表
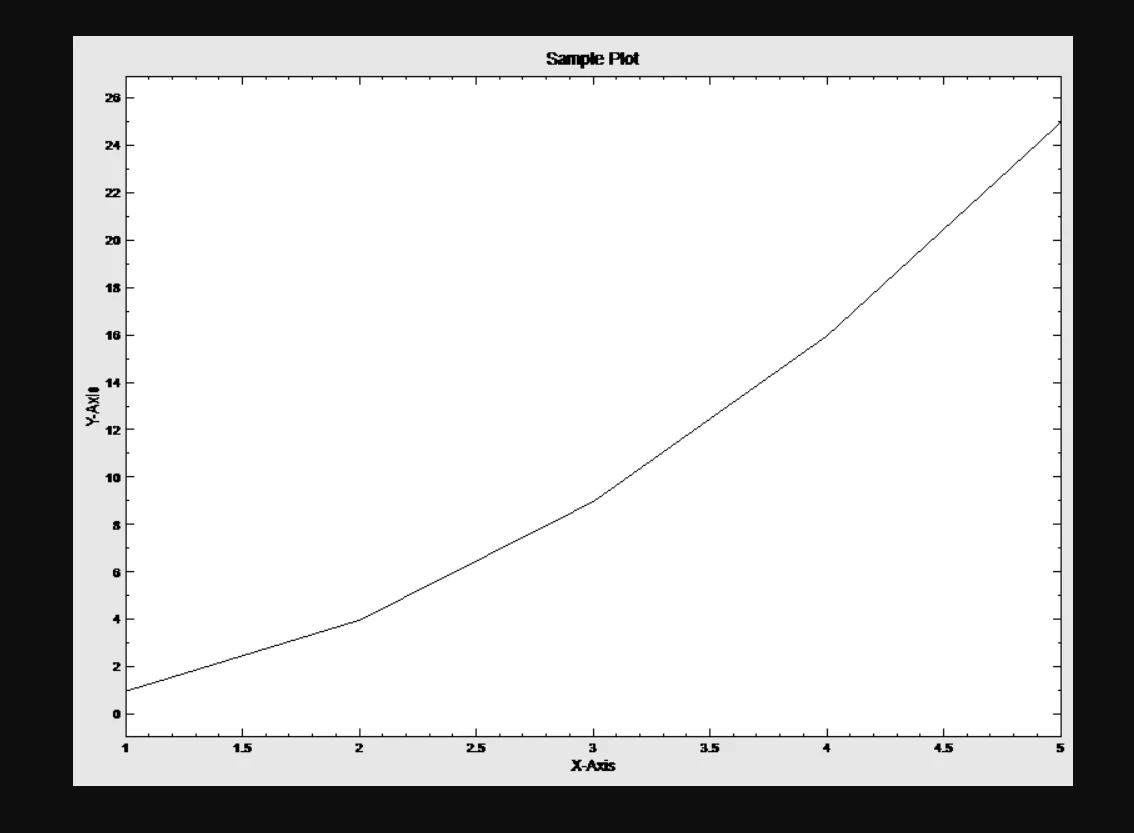
讓我們建立一個簡單的線圖作為第一張圖表:
設定繪圖表面:建立一個 PlotSurface2D 物件。 這可作為您繪圖的畫布。 設定一些顯示屬性以自訂其外觀,例如背景顏色和標題。
在圖表中新增資料:使用 NPlot 的 LinePlot 類別建立折線圖。 新增屬於一個或多個類別的資料值。 這些資料點將會繪製在圖表上。
顯示圖表:將折線圖新增至繪圖表面。 將繪圖面渲染成表格或使用者控制項以供顯示。
using System;
using NPlot;

class Program
{
    static void Main()
    {
        // Create a new bitmap plot surface
        var plotSurface = new NPlot.Bitmap.PlotSurface2D(800, 600);

        // Create a line plot
        var linePlot = new LinePlot
        {
            AbscissaData = new double[] { 1, 2, 3, 4, 5 },
            OrdinateData = new double[] { 1, 4, 9, 16, 25 }
        };

        // Add the line plot to the plot surface
        plotSurface.Add(linePlot);

        // Customize the plot (e.g., titles, labels)
        plotSurface.Title = "Sample Plot";
        plotSurface.XAxis1.Label = "X-Axis";
        plotSurface.YAxis1.Label = "Y-Axis";

        // Refresh the plot to render it
        plotSurface.Refresh();

        // Save the plot as a PNG image
        plotSurface.Bitmap.Save("c://plot.png", System.Drawing.Imaging.ImageFormat.Png);

        Console.WriteLine("Plot saved as plot.png");
    }
}
using System;
using NPlot;
class Program
{
static void Main()
{
// Create a new bitmap plot surface
var plotSurface = new NPlot.Bitmap.PlotSurface2D(800, 600);
// Create a line plot
var linePlot = new LinePlot
{
AbscissaData = new double[] { 1, 2, 3, 4, 5 },
OrdinateData = new double[] { 1, 4, 9, 16, 25 }
};
// Add the line plot to the plot surface
plotSurface.Add(linePlot);
// Customize the plot (e.g., titles, labels)
plotSurface.Title = "Sample Plot";
plotSurface.XAxis1.Label = "X-Axis";
plotSurface.YAxis1.Label = "Y-Axis";
// Refresh the plot to render it
plotSurface.Refresh();
// Save the plot as a PNG image
plotSurface.Bitmap.Save("c://plot.png", System.Drawing.Imaging.ImageFormat.Png);
Console.WriteLine("Plot saved as plot.png");
}
}Imports System
Imports NPlot
Friend Class Program
Shared Sub Main()
' Create a new bitmap plot surface
Dim plotSurface = New NPlot.Bitmap.PlotSurface2D(800, 600)
' Create a line plot
Dim linePlot As New LinePlot With {
.AbscissaData = New Double() { 1, 2, 3, 4, 5 },
.OrdinateData = New Double() { 1, 4, 9, 16, 25 }
}
' Add the line plot to the plot surface
plotSurface.Add(linePlot)
' Customize the plot (e.g., titles, labels)
plotSurface.Title = "Sample Plot"
plotSurface.XAxis1.Label = "X-Axis"
plotSurface.YAxis1.Label = "Y-Axis"
' Refresh the plot to render it
plotSurface.Refresh()
' Save the plot as a PNG image
plotSurface.Bitmap.Save("c://plot.png", System.Drawing.Imaging.ImageFormat.Png)
Console.WriteLine("Plot saved as plot.png")
End Sub
End Class以下是輸出的繪圖影像:
使用 NPlot 的進階製圖技術
在掌握基本圖形之後,NPlot 提供一系列更複雜的圖表類型,以增強您的資料可視化能力。 這些工具包括柱狀圖、散點圖和階梯圖,各自適合不同類型的資料表示。
使用條狀圖和散點圖
長條圖:非常適合顯示一個或多個類別中的資料值。 每個橫條代表一個資料值,其高度表示該值的大小。
散點圖:非常適合視覺化每個資料點相互獨立的資料集。 它可將資料點描繪在二維圖形上,以便分析模式或趨勢。
實作階梯圖
階梯圖:用於處理涉及連續橫座標值的數據,例如時間序列資料。 它創造了類似階梯的表示方式,清楚地顯示出連續資料點之間的變化。
將 NPlot 與 IronPDF 整合
NPlot 與 IronPDF 的整合可將圖表無縫轉換成 PDF 文件。 IronPDF 是一個功能強大的函式庫,可將 HTML 內容和圖形類渲染成高品質的 PDF 檔案。 這種整合對需要產生報告或記錄分析資料的應用程式特別有用。
開始使用 IronPDF
安裝 IronPDF Library
使用 NuGet 套件管理員安裝
若要使用 NuGet Package Manager 將 IronPDF 整合至您的 NPlot C# 專案,請遵循下列步驟:
1.開啟 Visual Studio,在解決方案總管中,用滑鼠右鍵按一下專案。 2.從上下文功能表中選擇"管理 NuGet 套件..."。 3.前往瀏覽標籤,搜尋 IronPDF。 4.從搜尋結果中選擇 IronPDF 函式庫,然後按一下安裝按鈕。 5.接受任何許可協議提示。
如果您想透過套件管理員控制台將 IronPDF 包含在專案中,請在套件管理員控制台執行下列指令:
Install-Package IronPdf
它將擷取 IronPDF 並安裝到您的專案中。
使用 NuGet 網站安裝
如需 IronPDF 的詳細概述,包括其功能、相容性和其他下載選項,請造訪 NuGet 網站上的 IronPDF 頁面,網址為 https://www.nuget.org/packages/IronPdf。
透過 DLL 安裝
另外,您也可以使用 IronPDF 的 dll 檔案,直接將 IronPDF 納入您的專案中。從 IronPDF 下載頁面下載包含 DLL 的 ZIP 檔案。 解壓縮,並將 DLL 包含在您的專案中。
使用 NPlot 生成動態圖表
NPlot 擅長於在 C# 應用程式中建立動態且具視覺吸引力的圖表。 本節將引導您產生一個散點圖,這是顯示具有兩個變數的資料的典型用例。
散狀圖對於可視化變數之間的關係特別有效。 按照以下步驟建立散點圖:
1.初始化繪圖表面:先建立一個 PlotSurface2D 實例。
2.準備資料:收集你想繪製的資料值。 散狀圖繪製的是個別的點,因此您需要兩個數值陣列:一個是 x 座標,另一個是 y 座標。 您可以根據需要向 PlotSurface2D 新增任意數量的圖表。
3.實例化散佈圖:使用 NPlot 的 PointPlot 或 ScatterPlot 類,用繪圖物件建立圖表。
4.自訂圖表:套用各種自訂設置,例如設定點樣式、顏色和座標軸屬性,使圖表更具資訊性和吸引力。
using NPlot;

class Program
{
    static void Main()
    {
        var plotSurface = new NPlot.Windows.PlotSurface2D();

        // Prepare data for the scatter plot
        var scatterPlot = new PointPlot
        {
            AbscissaData = new double[] { /* x-coordinates */ },
            OrdinateData = new double[] { /* y-coordinates */ }
        };

        // Add the scatter plot to the plot surface
        plotSurface.Add(scatterPlot);

        // Customize the chart and render the plotSurface
        plotSurface.Refresh();
    }
}
using NPlot;
class Program
{
static void Main()
{
var plotSurface = new NPlot.Windows.PlotSurface2D();
// Prepare data for the scatter plot
var scatterPlot = new PointPlot
{
AbscissaData = new double[] { /* x-coordinates */ },
OrdinateData = new double[] { /* y-coordinates */ }
};
// Add the scatter plot to the plot surface
plotSurface.Add(scatterPlot);
// Customize the chart and render the plotSurface
plotSurface.Refresh();
}
}Imports NPlot
Friend Class Program
Shared Sub Main()
Dim plotSurface = New NPlot.Windows.PlotSurface2D()
' Prepare data for the scatter plot
Dim scatterPlot = New PointPlot With {
.AbscissaData = New Double() { },
.OrdinateData = New Double() { }
}
' Add the scatter plot to the plot surface
plotSurface.Add(scatterPlot)
' Customize the chart and render the plotSurface
plotSurface.Refresh()
End Sub
End Class使用 IronPDF 將圖表轉換成 PDF
使用 NPlot 建立圖表後,您可以使用 IronPDF 將此圖表轉換成 PDF 文件。 這個過程包括將圖表渲染成圖像,然後用 IronPDF 將此圖像嵌入 PDF 中。 您可以按照以下步驟將圖表轉換為 PDF:
1.將圖表渲染為圖像:首先,將您的 NPlot 圖表轉換為圖像格式。 這可以透過將 PlotSurface2D 繪製到位圖上來實現。
2.使用 IronPDF 建立 PDF:使用 IronPDF 的 API 建立一個新的 PDF 文件並插入圖表影像。
using IronPdf;

class Program
{
    static void Main()
    {
        // Assuming 'chartImagePath' is the path to the Bitmap image of your NPlot chart
        var imageFiles = new string[] { "chartImagePath" };

        // Convert image files to PDF and save the output
        ImageToPdfConverter.ImageToPdf(imageFiles).SaveAs("Chart.pdf");
    }
}
using IronPdf;
class Program
{
static void Main()
{
// Assuming 'chartImagePath' is the path to the Bitmap image of your NPlot chart
var imageFiles = new string[] { "chartImagePath" };
// Convert image files to PDF and save the output
ImageToPdfConverter.ImageToPdf(imageFiles).SaveAs("Chart.pdf");
}
}Imports IronPdf
Friend Class Program
Shared Sub Main()
' Assuming 'chartImagePath' is the path to the Bitmap image of your NPlot chart
Dim imageFiles = New String() { "chartImagePath" }
' Convert image files to PDF and save the output
ImageToPdfConverter.ImageToPdf(imageFiles).SaveAs("Chart.pdf")
End Sub
End Class結論
在本教程中,我們探討了 C# 中兩個功能強大的函式庫的整合:NPlot 用於從依賴資料的元素中建立動態、資料驅動的圖表,而 IronPDF 用於將這些圖表轉換成 PDF 文件。
這種組合為 C# 開發人員提供了全面的工具包,讓他們能夠有效地將資料視覺化,然後將資料無縫轉換成可分享的存檔格式。
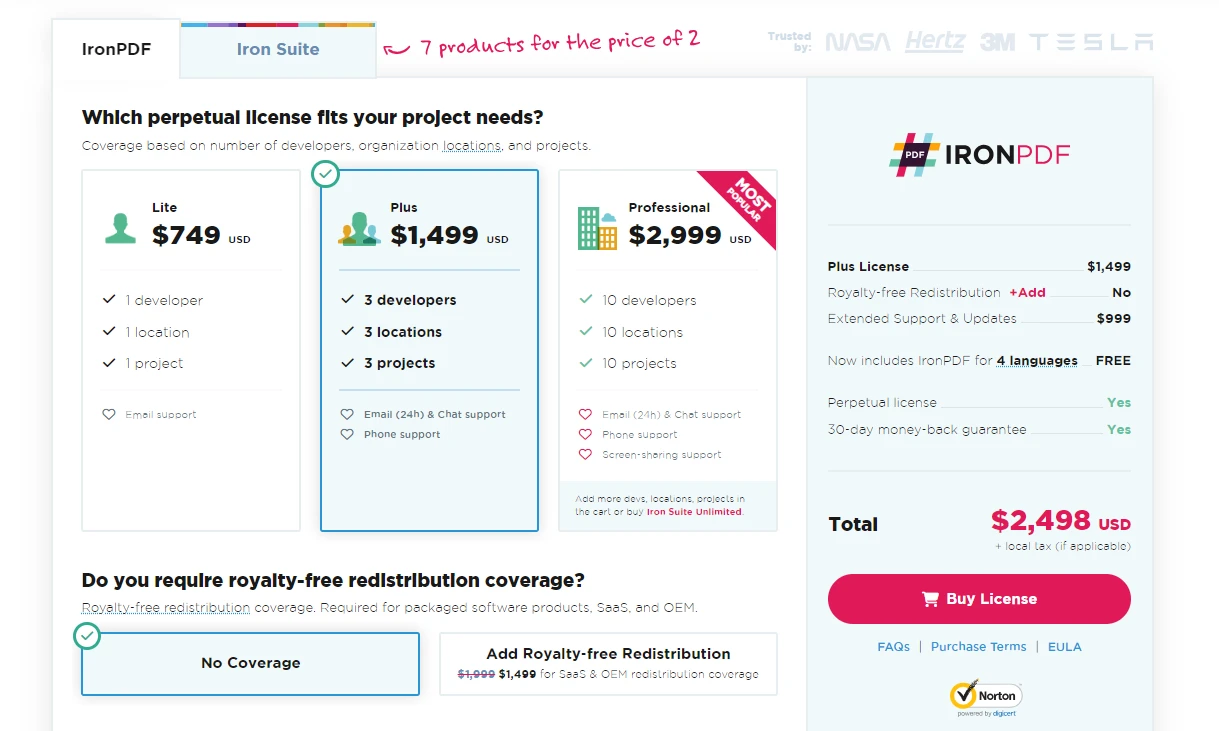
首先使用 IronPDF 的免費試用許可證,可從 $999 取得。
常見問題
什麼是NPlot以及它在C#中的用法?
NPlot是一個多功能的圖表庫,適用於.NET框架,用於在C#中生成各種類型的圖形和圖表。它非常適合於可視化從簡單折線圖到複雜散佈圖的小型和大型數據集。
如何在C#專案中安裝NPlot?
您可以使用Visual Studio中的NuGet套件管理器在C#專案中安裝NPlot。進入“工具”>“NuGet套件管理器”>“管理解決方案的NuGet套件...”,搜索“NPlot”並繼續安裝。
如何使用NPlot在C#中創建圖表?
要使用NPlot創建圖表,先初始化一個PlotSurface2D對象,使用您的數據創建一個LinePlot,然後將其添加到繪圖表面。用標題、標籤進行自定義,然後渲染圖表。
NPlot中有哪些高級圖表技術?
NPlot提供了諸如柱狀圖、散佈圖和步進圖等高級圖表技術,允許您以各種可視化格式有效地表示數據。
如何使用NPlot圖表與IronPDF?
IronPDF可以將使用NPlot創建的圖表轉換為高質量的PDF文檔,這在生成報告或記錄數據分析的可共享格式中非常有用。
如何將IronPDF添加到我的C#專案中?
要將IronPDF添加到您的專案中,使用Visual Studio中的NuGet套件管理器來安裝IronPDF,或從IronPDF網站下載DLL並手動將其包含在您的專案中。
如何使用IronPDF將NPlot圖表轉換為PDF?
首先,將您的NPlot圖表渲染為圖像。然後,使用IronPDF的API來創建PDF文檔並插入圖表圖像。這一過程允許您輕鬆地將圖像文件轉換為PDF格式。
使用NPlot和IronPDF在一起有哪些優勢?
使用NPlot與IronPDF組合,開發者可以創建詳細的動態圖表,然後將其轉換為PDF進行報告和文檔,從而有效地結合數據可視化與歸檔功能。
有沒有可供開發者使用的IronPDF試用版?
是的,有免費的IronPDF試用許可證可用,使開發者能夠在承諾購買完整許可證之前探索其功能和能力。