Livecharts C#(對於開發者的運行原理)
LiveCharts 是專為 .NET 開發人員設計的函式庫。 LiveCharts 有助於在 C# 應用程式中建立動態且美觀的圖表。 這表示當您的資料變更時,您的圖表會自動刷新。 LiveCharts 不僅適用於傳統應用程式; 它支援 Windows Presentation Foundation (WPF),使其成為桌面應用程式的多用途工具。
主要功能和優點
您正在尋找資料可視化需求的答案嗎? LiveCharts 提供功能廣泛的綜合解決方案。 以下是一些重點:
*自動動畫:*圖表自動動畫,無需額外程式碼即可流暢更新,使您的資料視覺化更具吸引力。 支援 WPF:您可以在 WPF 應用程式中使用 LiveCharts,從而實現豐富的使用者介面。 高效能:旨在提高效能、速度和效率,尤其是在處理大型資料集時。 靈活性:它簡單、靈活、互動且易於使用,而且從一開始就能滿足您的需求,同時還允許進行複雜的自訂,以滿足您的專案需求。 互動式圖表:使用者可以與圖表進行交互,增強資料探索能力。 圖表類型豐富多樣:**無論您的資料視覺化需求是什麼,LiveCharts 都提供相應的圖表類型。
LiveCharts 將複雜的資料轉換成互動、吸引人的視覺呈現。 其易用性和靈活性使其成為開發人員的強大工具。 使用功能強大的 LiveCharts,開發人員可以將複雜的資料轉換成互動、引人入勝的視覺表現。 我們將探討 LiveCharts 的功能及其與 IronPDF 函式庫的整合。
開始使用 LiveCharts。
設定您的開發環境以使用 LiveCharts 是很直接的,而且存取其原始碼可以加強客製化和理解。 本節將引導您完成初始步驟,並協助您建立第一份圖表。
設定您的環境
若要使用 LiveCharts,請確認已安裝 Visual Studio。 然後,將 LiveCharts 套件(一個專為動態資料視覺化而設計的幾何套件)加入您的專案。 您可以透過 NuGet Package Manager 來完成。 搜尋 LiveCharts,並安裝最新版本。 此流程會為您的專案加入所有必要的參考資料。
您使用 LiveCharts 的第一張圖表
建立您的第一份圖表只需要幾個簡單的步驟。 首先,在應用程式的使用者介面中加入圖表控制項。 如果您使用的是 WPF,您可以用 XAML 或 C# 程式化來完成。
以下是 XAML 中的基本範例:
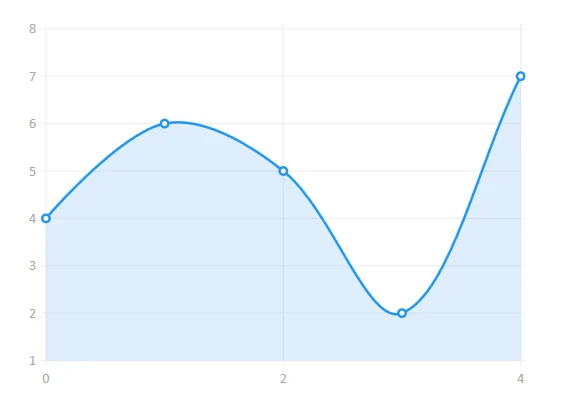
<lvc:CartesianChart Series="{Binding MySeries}"/><lvc:CartesianChart Series="{Binding MySeries}"/>在您的 C# 程式碼中,為您的圖表準備資料。 對於基本的折線圖,您需要一個 SeriesCollection。 您可以使用 LineSeries 填充此集合,將 Values 設定為您的資料點。
public SeriesCollection MySeries { get; set; }

public MainWindow()
{
    InitializeComponent();
    // Initialize the series collection and bind data
    MySeries = new SeriesCollection
    {
        new LineSeries
        {
            Values = new ChartValues<double> { 4, 6, 5, 2, 7 }
        }
    };
    // Bind the data context to this instance
    DataContext = this;
}
public SeriesCollection MySeries { get; set; }
public MainWindow()
{
InitializeComponent();
// Initialize the series collection and bind data
MySeries = new SeriesCollection
{
new LineSeries
{
Values = new ChartValues<double> { 4, 6, 5, 2, 7 }
}
};
// Bind the data context to this instance
DataContext = this;
}Public Property MySeries() As SeriesCollection
'INSTANT VB WARNING: The following constructor is declared outside of its associated class:
'ORIGINAL LINE: public MainWindow()
Public Sub New()
InitializeComponent()
' Initialize the series collection and bind data
MySeries = New SeriesCollection
From {
New LineSeries With {
.Values = New ChartValues(Of Double) From {4, 6, 5, 2, 7}
}
}
' Bind the data context to this instance
DataContext = Me
End Sub此程式碼片段會建立一個簡單的折線圖。 它會在直角坐標圖上顯示一系列數值。 切記設定視窗或控制項的 DataContext 以確保圖表與您的資料綁定。
只要遵循這些步驟,您就可以建立並執行基本的圖表。 這只是個開始。 LiveCharts 允許更複雜的互動式資料可視化。
探索 LiveCharts 功能
LiveCharts 不只是顯示靜態資料。 其真正的威力在於它能夠即時更新、對資料變更作出反應,並提供多種圖表類型。本節將深入探討這些功能,並提供範例幫助您掌握這些概念。
瞭解資料綁定與更新
資料綁定是 LiveCharts 的核心概念。 它可以讓您的圖表自動反映資料的變更。 此功能對於處理動態資料來源的應用程式特別有用。
考慮一個追蹤股票價格的應用程式。 當有新資料時,您希望您的圖表能夠更新。 使用 LiveCharts,您只需更新資料來源,圖表就會偵測到這些變更,並隨之更新。
以下是如何將圖表與資料來源綁定:
var myValues = new ChartValues<double> { 3, 4, 6, 3, 2 };
var lineSeries = new LineSeries
{
    Values = myValues
};

// Add the line series to the series collection
mySeries.Add(lineSeries);

// When data changes
myValues.Add(5); // The chart updates automatically
var myValues = new ChartValues<double> { 3, 4, 6, 3, 2 };
var lineSeries = new LineSeries
{
Values = myValues
};
// Add the line series to the series collection
mySeries.Add(lineSeries);
// When data changes
myValues.Add(5); // The chart updates automaticallyDim myValues = New ChartValues(Of Double) From {3, 4, 6, 3, 2}
Dim lineSeries As New LineSeries With {.Values = myValues}
' Add the line series to the series collection
mySeries.Add(lineSeries)
' When data changes
myValues.Add(5) ' The chart updates automatically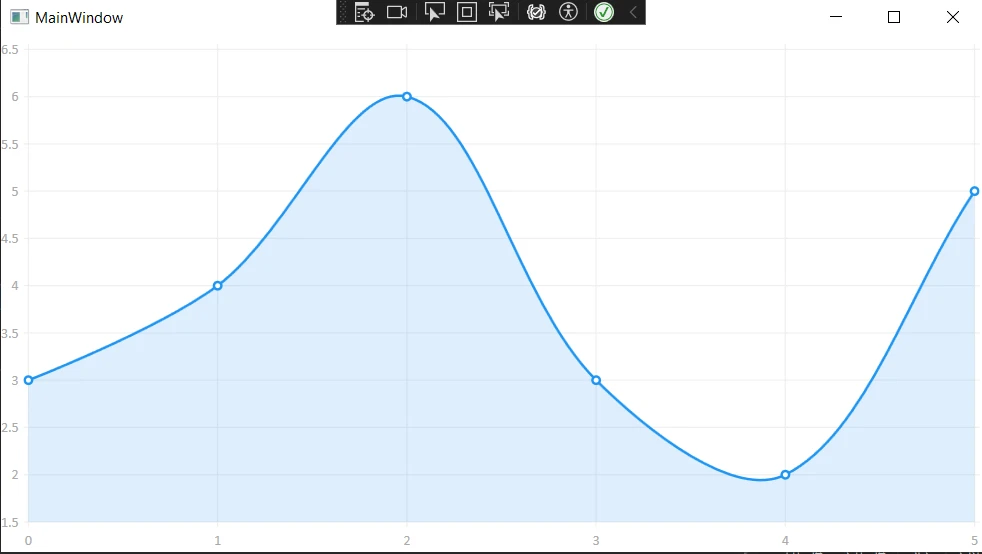
深入瞭解圖表類型
LiveCharts 支援多種圖表類型,每種類型都適合不同類型的資料可視化需求。 以下是幾個範例:
*線條系列:*非常適合展示一段時間內的趨勢。 圓餅圖:**最適合顯示資料集中的比例。 *長條圖:可用於比較不同類別之間的數量。
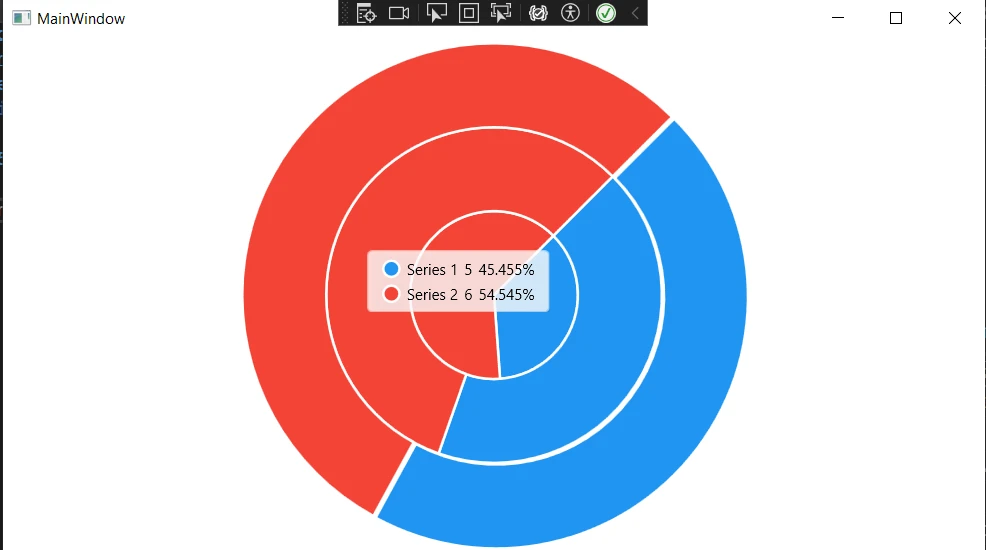
若要建立圓餅圖表,您會使用 PieSeries 類別。 以下是一個快速範例:
public SeriesCollection MyPieSeries { get; set; }

public MainWindow()
{
    InitializeComponent();
    // Initialize the pie series collection and bind data
    MyPieSeries = new SeriesCollection
    {
        new PieSeries
        {
            Values = new ChartValues<double> { 4, 6, 5 },
            Title = "Series 1"
        },
        new PieSeries
        {
            Values = new ChartValues<double> { 7, 8, 6 },
            Title = "Series 2"
        }
    };
    // Bind the data context to this instance
    DataContext = this;
}
public SeriesCollection MyPieSeries { get; set; }
public MainWindow()
{
InitializeComponent();
// Initialize the pie series collection and bind data
MyPieSeries = new SeriesCollection
{
new PieSeries
{
Values = new ChartValues<double> { 4, 6, 5 },
Title = "Series 1"
},
new PieSeries
{
Values = new ChartValues<double> { 7, 8, 6 },
Title = "Series 2"
}
};
// Bind the data context to this instance
DataContext = this;
}Public Property MyPieSeries() As SeriesCollection
'INSTANT VB WARNING: The following constructor is declared outside of its associated class:
'ORIGINAL LINE: public MainWindow()
Public Sub New()
InitializeComponent()
' Initialize the pie series collection and bind data
MyPieSeries = New SeriesCollection
From {
New PieSeries With {
.Values = New ChartValues(Of Double) From {4, 6, 5},
.Title = "Series 1"
},
New PieSeries With {
.Values = New ChartValues(Of Double) From {7, 8, 6},
.Title = "Series 2"
}
}
' Bind the data context to this instance
DataContext = Me
End Sub這個程式碼片段設定了一個有兩個資料系列的基本圓餅圖。 就像線圖範例一樣,它將 PieSeries 繫結到 Values 屬性。
LiveCharts 也提供圖表外觀與行為的彈性與控制。 您可以自訂幾乎所有方面,從顏色和標籤到動畫和互動性。 這可讓您量身打造的圖表完全符合應用程式的外觀與感覺。
IronPDF 簡介
將 LiveCharts 與 IronPDF 整合,可縮短動態資料可視化與靜態報表生成之間的距離。 IronPDF 是一個功能強大的 C# 函式庫,可讓開發人員以程式化的方式建立、處理和轉換 PDF 文件。
結合 LiveCharts 可建立包含您的互動式圖表的 PDF 報表。 本節介紹 IronPDF,並指導您如何在專案中設定 IronPDF。
為什麼選擇 IronPDF?
IronPDF的HTML到PDF的轉換能力在其他PDF函式庫不足的地方表現優異,尤其是其將HTML渲染為PDF的能力。 此功能在使用 LiveCharts 時特別有用,因為您可以將圖表渲染為 HTML 畫布,然後將這些畫布轉換為 PDF 文件。 IronPDF 完全支援 CSS3、JavaScript 和 HTML5,可確保您的圖表在 PDF 輸出中看起來與預期一致。
LiveCharts 與 IronPDF
以下是一個詳細的程式碼範例,說明使用 LiveCharts 建立圖表、匯出圖表,然後再使用 IronPDF 產生包含此圖表的 PDF 報表的過程。 本範例假設您已基本瞭解如何使用 LiveCharts 和 IronPDF。
首先,確保您已透過 NuGet 在專案中安裝 LiveCharts 和 IronPDF 套件。
步驟 1:使用 LiveCharts 產生圖表
讓我們先使用 LiveCharts 建立一個簡單的折線圖。 為了簡單起見,本範例將著重於產生圖表,並將其儲存為圖片,稍後將包含在我們的 PDF 中。
private void GenerateChartButton_Click(object sender, RoutedEventArgs e)
{
    CreateAndSaveChartImage();
}

public void CreateAndSaveChartImage()
{
    // Create the series collection for the chart
    var seriesCollection = new SeriesCollection
    {
        new LineSeries
        {
            Values = new ChartValues<double> { 4, 6, 5, 2, 7 },
            Title = "Sample Series"
            // You can set other properties like color, point geometry, etc.
        }
    };

    // Initialize the CartesianChart
    var chart = new CartesianChart
    {
        Series = seriesCollection,
        Width = 400,
        Height = 300,
        Background = Brushes.White
    };

    // Add chart to the UI
    ChartContainer.Child = chart;

    // Force the chart to update
    chart.Update(true, true);

    // Save the rendered chart as an image
    SaveChartToImage(chart);
}

private void SaveChartToImage(CartesianChart chart)
{
    // Measure and arrange the chart to ensure correct layout
    chart.Measure(new Size(chart.Width, chart.Height));
    chart.Arrange(new Rect(0, 0, chart.Width, chart.Height));

    // Create a render target bitmap and render the chart on it
    var renderTargetBitmap = new RenderTargetBitmap(
        (int)chart.ActualWidth, (int)chart.ActualHeight,
        96, 96, PixelFormats.Pbgra32);

    renderTargetBitmap.Render(chart);

    // Encode the rendered image to a PNG format
    var encoder = new PngBitmapEncoder();
    encoder.Frames.Add(BitmapFrame.Create(renderTargetBitmap));

    // Define the path where the chart will be saved
    string path = "chart.png";

    // Save the encoded PNG to the file system
    using (var stream = File.Create(path))
    {
        encoder.Save(stream);
    }

    // Inform the user of the successful save
    MessageBox.Show($"Chart saved as {path}");
}
private void GenerateChartButton_Click(object sender, RoutedEventArgs e)
{
CreateAndSaveChartImage();
}
public void CreateAndSaveChartImage()
{
// Create the series collection for the chart
var seriesCollection = new SeriesCollection
{
new LineSeries
{
Values = new ChartValues<double> { 4, 6, 5, 2, 7 },
Title = "Sample Series"
// You can set other properties like color, point geometry, etc.
}
};
// Initialize the CartesianChart
var chart = new CartesianChart
{
Series = seriesCollection,
Width = 400,
Height = 300,
Background = Brushes.White
};
// Add chart to the UI
ChartContainer.Child = chart;
// Force the chart to update
chart.Update(true, true);
// Save the rendered chart as an image
SaveChartToImage(chart);
}
private void SaveChartToImage(CartesianChart chart)
{
// Measure and arrange the chart to ensure correct layout
chart.Measure(new Size(chart.Width, chart.Height));
chart.Arrange(new Rect(0, 0, chart.Width, chart.Height));
// Create a render target bitmap and render the chart on it
var renderTargetBitmap = new RenderTargetBitmap(
(int)chart.ActualWidth, (int)chart.ActualHeight,
96, 96, PixelFormats.Pbgra32);
renderTargetBitmap.Render(chart);
// Encode the rendered image to a PNG format
var encoder = new PngBitmapEncoder();
encoder.Frames.Add(BitmapFrame.Create(renderTargetBitmap));
// Define the path where the chart will be saved
string path = "chart.png";
// Save the encoded PNG to the file system
using (var stream = File.Create(path))
{
encoder.Save(stream);
}
// Inform the user of the successful save
MessageBox.Show($"Chart saved as {path}");
}Imports System
Private Sub GenerateChartButton_Click(ByVal sender As Object, ByVal e As RoutedEventArgs)
CreateAndSaveChartImage()
End Sub
Public Sub CreateAndSaveChartImage()
' Create the series collection for the chart
Dim seriesCollection As New SeriesCollection
From {
New LineSeries With {
.Values = New ChartValues(Of Double) From {4, 6, 5, 2, 7},
.Title = "Sample Series"
}
}
' Initialize the CartesianChart
Dim chart = New CartesianChart With {
.Series = seriesCollection,
.Width = 400,
.Height = 300,
.Background = Brushes.White
}
' Add chart to the UI
ChartContainer.Child = chart
' Force the chart to update
chart.Update(True, True)
' Save the rendered chart as an image
SaveChartToImage(chart)
End Sub
Private Sub SaveChartToImage(ByVal chart As CartesianChart)
' Measure and arrange the chart to ensure correct layout
chart.Measure(New Size(chart.Width, chart.Height))
chart.Arrange(New Rect(0, 0, chart.Width, chart.Height))
' Create a render target bitmap and render the chart on it
Dim renderTargetBitmap As New RenderTargetBitmap(CInt(Math.Truncate(chart.ActualWidth)), CInt(Math.Truncate(chart.ActualHeight)), 96, 96, PixelFormats.Pbgra32)
renderTargetBitmap.Render(chart)
' Encode the rendered image to a PNG format
Dim encoder = New PngBitmapEncoder()
encoder.Frames.Add(BitmapFrame.Create(renderTargetBitmap))
' Define the path where the chart will be saved
Dim path As String = "chart.png"
' Save the encoded PNG to the file system
Using stream = File.Create(path)
encoder.Save(stream)
End Using
' Inform the user of the successful save
MessageBox.Show($"Chart saved as {path}")
End Sub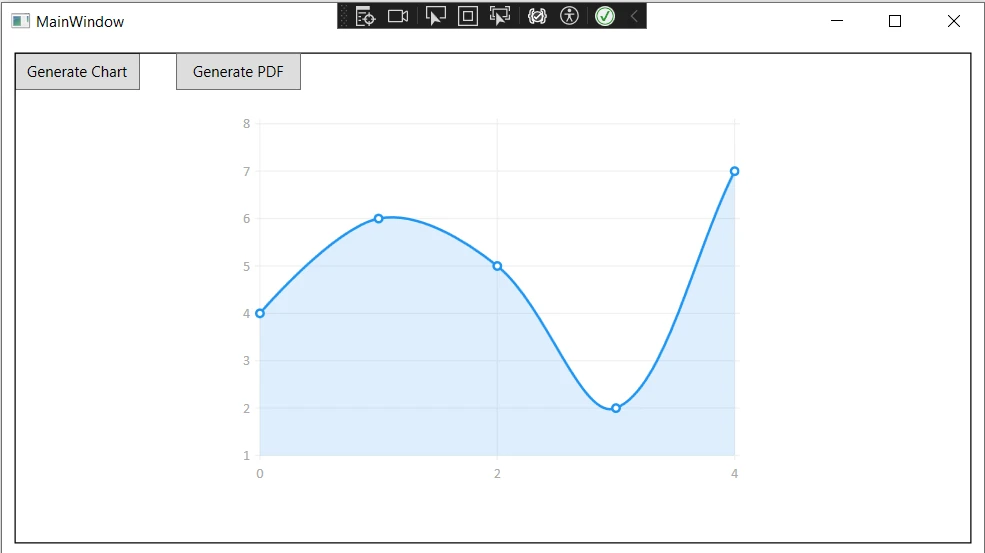
步驟 2:建立 HTML 模板並插入圖表
現在,我們要準備 HTML 內容,將剛才儲存的圖表嵌入為圖片。
string htmlContent = @"
<html>
<body>
    <h1>Chart Report</h1>
    <img src='chart.png' alt='Chart'>
    <p>This is a report generated by combining LiveCharts and IronPDF.</p>
</body>
</html>";
步驟 3:使用 IronPDF 將 HTML 轉換為 PDF。
最後,我們會使用 IronPDF 將 HTML 內容 (包括內嵌的圖表影像) 轉換成 PDF 文件。
using IronPdf;

public void CreatePdfReport(string htmlContent)
{
    // Initialize the HTML to PDF converter
    var renderer = new ChromePdfRenderer();

    // Render the HTML content as a PDF
    var pdf = renderer.RenderHtmlAsPdf(htmlContent);

    // Save the rendered PDF to the file system
    pdf.SaveAs("Report.pdf");
}
using IronPdf;
public void CreatePdfReport(string htmlContent)
{
// Initialize the HTML to PDF converter
var renderer = new ChromePdfRenderer();
// Render the HTML content as a PDF
var pdf = renderer.RenderHtmlAsPdf(htmlContent);
// Save the rendered PDF to the file system
pdf.SaveAs("Report.pdf");
}Imports IronPdf
Public Sub CreatePdfReport(ByVal htmlContent As String)
' Initialize the HTML to PDF converter
Dim renderer = New ChromePdfRenderer()
' Render the HTML content as a PDF
Dim pdf = renderer.RenderHtmlAsPdf(htmlContent)
' Save the rendered PDF to the file system
pdf.SaveAs("Report.pdf")
End Sub如果您的圖表影像與應用程式的可執行檔不在同一目錄中,請務必使用正確路徑取代 htmlContent 字串中的 "chart.png"。
本範例涵蓋一個基本情境以說明流程。 根據您的特定需求,您可能需要調整程式碼,尤其是關於如何處理圖表與圖片來源。
進階技術與秘訣
為了進一步加強整合:
*最佳化效能:*對於大型資料集或複雜圖表,請考慮最佳化 LiveCharts 和 IronPDF 的效能,以確保快速載入和流暢運行。 互動式 PDF:**雖然 PDF 是靜態的,但添加超連結或書籤可以改善導航,使報告更易於使用。 *自訂樣式:在 HTML 範本中使用 CSS,以確保報表符合您的企業品牌或設計指南。
結論
總而言之,整合 LiveCharts 與 IronPDF for .NET 可為希望建立動態、具視覺吸引力圖表的 .NET 開發人員提供強大的組合,並將其納入專業風格的 PDF 報表中。 這種協同效應不僅增強了資料的呈現,也透過促進從動態資料集製作靜態報表來擴大應用程式的效用。
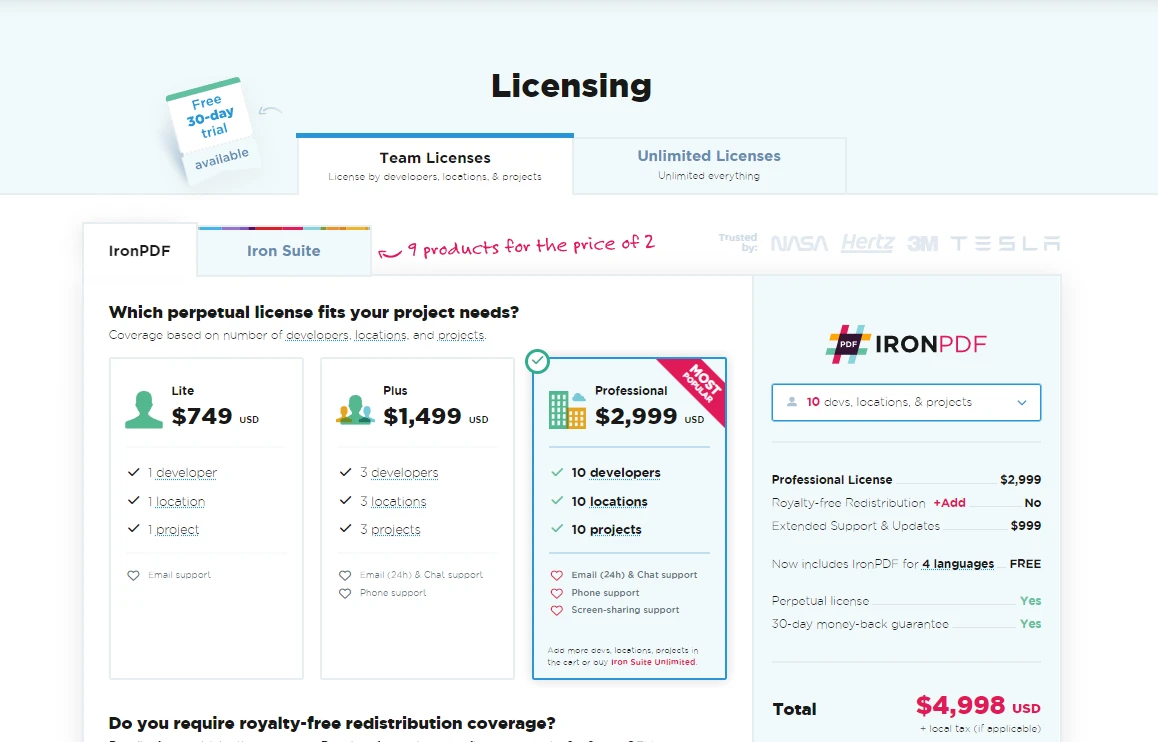
IronPDF 將 HTML 繪製成 PDF 的功能,完全支援 CSS3、JavaScript 和 HTML5,可確保您的圖表從螢幕無縫轉換到印刷頁面。 對於有興趣探索此功能的用戶,IronPDF 提供免費試用版,價格從 $999 起,為 .NET 應用程式中的高品質報表產生提供經濟高效的解決方案。
常見問題
如何在C#中將LiveCharts整合到PDF庫中?
要將LiveCharts與PDF庫整合,可以將圖表渲染為圖像,將其併入HTML文件,然後使用IronPDF將此HTML文件轉換為PDF。這樣可以讓您的PDF報告中包含動態的圖表視覺效果。
我可以在C#中將HTML圖表轉換為PDF嗎?
可以,您可以使用IronPDF將HTML圖表轉換為PDF。IronPDF可以獲取包含圖表渲染的HTML內容並將其轉換為PDF文件,保留圖表的互動性和視覺元素。
使用LiveCharts對C#應用程式有哪些好處?
LiveCharts提供多項好處,包括自動動畫、支援實時資料更新、大資料集的高性能和多種圖表類型。它還兼容WPF,增強桌面應用的開發。
如何確保我在C#應用程式中的圖表自動更新?
LiveCharts支援資料綁定,允許圖表在基礎資料更改時自動更新。此功能尤其適合需要實時資料可視化的應用程式,如股價追蹤。
使PDF庫適合圖表整合的功能有哪些?
一個適合圖表整合的PDF庫,如IronPDF,應支援HTML到PDF轉換,允許CSS3和JavaScript樣式化,並在圖表渲染為PDF格式時保持其視覺完整性。它還應該提供嵌入圖像和其他交互元素的選項。
如何使用C#創建互動式PDF報告?
您可以使用IronPDF將包括JavaScript驅動的互動元素和圖表的HTML內容轉換為PDF格式,從而創建互動式PDF報告。這種方法保持了生成的PDF中的互動性和視覺吸引力。
在.NET項目中設置LiveCharts的過程是什麼?
要在.NET項目中設置LiveCharts,需要在Visual Studio中通過NuGet安裝LiveCharts包。安裝後,您可以將圖表控件添加到應用程式的UI中,並使用C#代碼將資料綁定到這些控件。
如何優化C#應用程式中的圖表和PDF性能?
為了優化性能,應最小化渲染的資料集大小,利用硬件加速進行圖表中的動畫,並使用異步處理。對於PDF,在轉換前優化HTML內容,並使用IronPDF提供的壓縮功能。
LiveCharts可以生成哪些類型的圖表?
LiveCharts可以生成多種類型的圖表,包括折線圖、餅圖、柱狀圖以及更複雜的系列。這種多樣性允許開發者選擇最適合其特定資料可視化需求的圖表類型。
可以免費試用PDF庫嗎?
可以,IronPDF提供免費試用,允許開發者評估其從HTML內容生成高品質PDF文檔的能力,包括圖表和其他視覺元素。